| Rank | China | Germany | France |
|---|---|---|---|
| 1 | Flowers, foliage and fruit, artificial (0.00%) | Microscopes (0.00%) | Spirits obtained by distilling grape wine (0.01%) |
| 2 | Solar panels (0.01%) | Kieserite, epsomite (0.00%) | Gum Arabic (0.00%) |
| 3 | Toilet and kitchen linen; of man-made fibres (0.00%) | Vinyl acetate copolymers (0.00%) | Wine; sparkling (0.01%) |
| 4 | Umbrellas and sun umbrellas (0.00%) | Paper (0.00%) | Lighters (0.00%) |
| 5 | Fabrics (0.00%) | Vinyl chloride (0.00%) | Cutlery (0.00%) |
| 6 | Rubber or plastics combs (0.00%) | Vacuum cleaners (0.00%) | Smoothing irons; electric (0.00%) |
| 7 | Air conditioning machines (0.00%) | Coats (0.00%) | Flax (0.00%) |
| 8 | Smartphones (0.05%) | Wood pulp (0.00%) | Waters (0.00%) |
| 9 | Amino-acids: lysine and its esters (0.00%) | Nitrites (0.00%) | Wood (0.00%) |
| 10 | Umbrellas and sun umbrellas (0.00%) | Phosphates (0.00%) | Amino-acids: glutamic acid and its esters (0.00%) |
| 11 | Blankets of synthetic fibres (0.00%) | Machinery and mechanical appliances; for public works (0.00%) | Perfumes and toilet waters (0.02%) |
| 12 | Artificial Flowers of materials other than plastics (0.00%) | Pens (0.00%) | Vegetable oils (0.00%) |
| 13 | Lamps (LED) (0.00%) | Iron oxides and hydroxides (0.00%) | Sodium (0.00%) |
| 14 | Bed linen; of man-made fibres (0.00%) | Centrifuges (0.00%) | Rubber; synthetic (0.00%) |
| 15 | Vacuum flasks and other vacuum vessels (0.00%) | Strontium carbonate (0.00%) | Cement (0.00%) |
| Note : 15 top ranked HS6 products in French, German and Chinese revealed comparative advantages in 2024. Share is the share in each country total exports. | |||
Converging Comparative Advantages: EU’s Second China Shock
China’s €1 trillion trade surplus in 2025 has revived fears of a second China shock in the EU. Using bilateral product-level trade data for 2002–2024, we estimate structural revealed comparative advantages to investigate whether China’s specialization is converging toward that of advanced economies. Convergence is a long-running process, largely under way in the decade following China’s accession to the WTO. The second shock differs less in its scale than in its composition. Since 2012 for Germany, and since 2019 for France and Italy, losses of comparative advantage relative to China have been increasingly concentrated in high-tech products. This shift is confined to the large euro-area economies, while the US, the UK, Japan and Poland have recently gained ground. Exposure also differs by country: China is Germany’s main competitor, whereas for France, changes relative to the US and Poland have also weighed recently. This convergence is structural and would persist even if China’s surplus shrank, and uneven exposure across member states makes a unified EU response harder.
1 Introduction
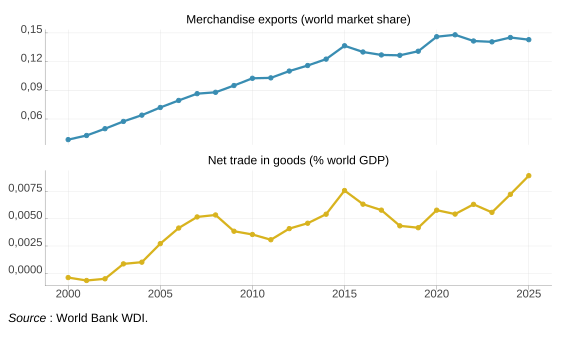
Over the last few years, China has consolidated an unprecedented trade surplus approaching €1 trillion in 2025 or 1% of world GDP and increased its share of global merchandise exports by 1.2 percentage point to 14.3% since 2019.12 These developments have revived concerns over what is increasingly referred to as the « second China shock », particularly in the European Union (EU).
1 We are grateful to Isabelle Méjean and Gianluca Orefice for their insightful discussions and suggestions throughout the project.
2 The size of China’s good surplus is however disputed; see (Setser and Peters, 2026).
3 Against 0.5 percentage points over 2019-2025.
4 In terms of trade surplus, the current episode is therefore the third of its kind, even if the label « second China shock » has become conventional and we stick to it in this publication.
While China’s trade surplus has reached an unprecedented level, its recent expansion is not unprecedented in magnitude. Over the last quarter century, China has already experienced two comparable episodes for the world trading system. During the first China shock (2002-2008) and a decade later (2011-2015), China increased its trade surplus by 0.4 and 0.6 percentage points of world GDP respectively3 and increased its global export market share by 3.8 and 3.4 percentage points (see Figure A.1).4
The first China shock, following China’s accession to the WTO in 2001, primarily affected industries such as textiles, apparel, furniture, toys and consumer electronics, that is, sectors intensive in low- and medium-skilled labor. 5 Today, China has become the world’s largest automobile exporter, a striking development in one of the manufacturing sectors long dominated by advanced economies. While China’s persistent trade surplus raises concerns for manufacturing industries in the rest of the world, the EU still records a sizeable surplus in trade in goods (around 2% of EU GDP in 2025) thanks to its trade with the rest of the world. 6
5 The first China shock has been analysed through the lenses of the local labour market effects of increasing imports from China following its WTO accession in 2001, particularly for the US (Autor, Dorn and Hanson, 2013).
6 See (Aprigliano et al., 2026 ; Jean, 2026 ; Tordoir and Setser, 2026) on the consequences of China’s trade surplus.
7 We focus here on trade in goods and disregard trade in services in which the EU has a trade surplus.
8 Rising US tariffs in 2018/2019 and 2025 have also redirected part of Chinese exports toward alternative markets, particularly the European Union (Emlinger et al., 2026).
For the EU, the key question is therefore not only whether China exports more than before, but whether its changing export specialization increasingly challenges sectors in which European economies have traditionally held comparative advantages.7 This structural question goes beyond prominent cases such as automobiles and solar panels and is distinct from the short-term redirection of Chinese exports towards the EU caused by US tariffs. 8
Answering this question requires looking beyond observed export patterns to identify how countries’ underlying productive strengths are evolving. China’s exports may grow simply because global demand is rising for the products it already exports, or because its main trading partners are experiencing faster economic growth. Changes in market access and trade costs can also boost exports without reflecting changes in productive specialization. Such developments do not necessarily imply greater competitive pressure on European producers. What matters for understanding the longer-term competitive challenge is whether China is gaining ground in products in which advanced economies have traditionally specialized.
Comparative advantage provides a way to identify such structural changes. Following Ricardo’s principle of comparative advantage, countries specialize in the sectors in which they are relatively more productive. Tracking changes in comparative advantage allows us to assess whether China’s productive specialization is converging towards that of advanced economies. If China’s productivity gains are concentrated in industries where advanced economies have traditionally excelled, its export expansion is likely to reshape competition in both domestic and third-country markets and may entail gains or losses for the rest of the world.9
9 See (Giovanni, Levchenko and Zhang, 2014) on the welfare effects of China’s growth for the rest of the world.
10 (Chowdhry, Erhardt and Hinz, 2026 ; Soyres et al., 2026) also document the rising similarity of China’s exports with advanced economies’ export structures, but do not isolate comparative advantages from market access, trade costs or demand.
We therefore estimate structural revealed comparative advantages from bilateral HS6 trade data following (Costinot, Donaldson and Komunjer, 2012 ; Leromain and Orefice, 2014). This approach identifies the evolution of countries’ underlying productive strengths while controlling for geography and other determinants of bilateral trade, allowing us to assess whether China is increasingly competing in products that constitute the traditional comparative advantages of advanced economies.10 Note that our approach remains agnostic about the sources of these comparative advantages, which may reflect technological progress, subsidies, wages, or exchange-rate policies.
Our results suggest that the second China shock differs less in its scale than in its composition. China’s convergence towards the specialization of advanced economies is largely a long-running process, already well under way in the decade following China’s WTO accession. What has changed is where competition bites: since 2012 for Germany, and 2019 for France and Italy, the erosion of comparative advantage relative to China has become increasingly concentrated on high-tech products, a shift confined to large euro area countries in our sample. Exposure is also highly uneven across countries: China is the main competitor in Germany’s key exported products, but not in France’s, where the United States and Poland have recently weighed more.
2 Tracking China’s productive specialization
Observed exports do not necessarily reflect countries’ underlying productive strengths. Export growth may result from geographical specialization, better market access or lower trade costs rather than changes in productive specialization. Yet what matters for long-term competitive pressure is not simply where China exports today, but whether China is gaining comparative advantage in the industries where advanced economies have traditionally specialized.
To isolate this productive dimension, we estimate structural revealed comparative advantages (SRCA) from bilateral HS6 trade data between 2002 and 2024.11 By controlling for geography, market access and other determinants of bilateral trade, the SRCA index identifies countries’ underlying comparative advantages rather than their observed export performance and provides a country specific ranking of products according to the strength of each country’s comparative advantage.12
11 The methodology is presented in appendix. We use data from BACI (202601 version, current HS nomenclature).
12 The country level product ranking is computed relative to a benchmark of the 20 largest trading economies.
Table 1 lists the 15 products in which France, Germany and China have the strongest comparative advantage in 2024. The index ranks products by the strength of specialization, not by export value. The top of the ranking therefore includes many niche products that weigh little in total exports. Germany’s list is dominated by basic chemicals, together with scientific instruments and machinery (microscopes, centrifuges, public works machinery). The list for France combines some flagship luxury and agri-food exports (cognac, sparkling wine, perfumes) with more traditional products such as cutlery or lighters. China’s top ranking combines high-technology products (smartphones, solar panels, LED lamps, air conditioners) with traditional labour-intensive goods (artificial flowers, umbrellas, household textiles). This pattern extends beyond anecdotal evidence on the very top products. Within China’s top 1000 products in terms of comparative advantage, the number of high-tech products increased from 40 in 2007 to 60 in 2024, reaching a level similar to France and larger than Italy, Spain or Poland.
3 China’s specialization is converging towards advanced economies
To move beyond individual products, we compare countries’ overall patterns of comparative advantage. We measure their similarity by comparing the ranking of all HS6 products according to their structural revealed comparative advantages.13 A higher correlation indicates that two countries tend to have comparative advantages in similar products, increasing the potential for competition in both domestic and export markets.
13 This measure does not account for the relative importance of products in a country’s exports. We account for this dimension later in section 3.
Figure 1 shows how similar each country’s pattern of comparative advantage is to China’s in 2002, 2012, 2019 and 2024. Three results stand out. First, the convergence between China and advanced economies occurred much earlier than is commonly assumed. Similarity increased rapidly during the first decade following China’s accession to the WTO, whereas changes have been much more gradual since the early 2010s. Rather than being a recent phenomenon driven solely by electric vehicles or other green products, China’s convergence towards advanced economies was well underway during the first China shock. Second, this convergence slowed markedly during the 2010s for most countries. Poland stands out as an exception in our sample of countries, with a sustained and stable path of convergence of comparative advantages with China over the full 2002-2024 period. Third, convergence has resumed since the Covid-19 pandemic for some countries, most clearly for Germany and the United States, and more modestly for France and Spain. Japan has continued along its earlier trend, while the United Kingdom and Italy show no further convergence.
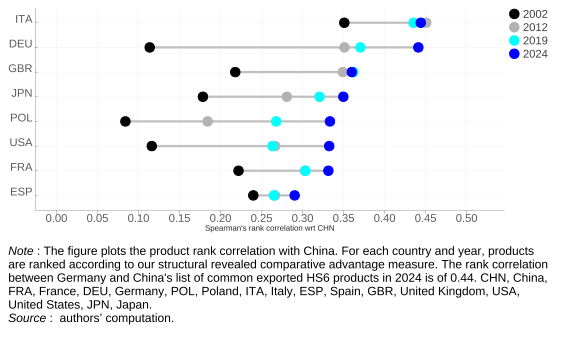
Germany and Italy illustrate two different paths. Italy was already the closest European economy to China in 2002 (0.35). It converged further by 2012 (0.45) and has been stable since. Germany started from a very low level, comparable to the US (around 0.11). It converged sharply during the first decade, and again after 2019, and now matches Italy’s level (0.44).
The cross-country comparison reported in Table 2 complements this dynamic perspective by comparing the productive specializations of China, France and Germany with those of selected economies in 2002 and 2024. In 2024, China’s specialization is most similar to that of Germany and Italy (0.44) among the countries considered, but also exhibits a high degree of similarity with Vietnam (0.40). This combination is consistent with the coexistence of comparative advantages in high-technology products and more traditional labor-intensive goods illustrated in Table 1. Interestingly, Germany’s specialization is now more similar to China’s (0.44) than to France’s (0.40) or Italy’s (0.35). France, by contrast, remains more closely aligned with Germany (0.40) and Italy (0.39) than with China (0.33).
| Country |
2024
|
2002
|
||||
|---|---|---|---|---|---|---|
| CHN | FRA | DEU | CHN | FRA | DEU | |
| CHN | 1.00 | 0.33 | 0.44 | 1.00 | 0.22 | 0.11 |
| FRA | 0.33 | 1.00 | 0.40 | 0.22 | 1.00 | 0.41 |
| DEU | 0.44 | 0.40 | 1.00 | 0.11 | 0.41 | 1.00 |
| POL | 0.33 | 0.29 | 0.32 | 0.08 | 0.00 | −0.14 |
| ITA | 0.44 | 0.39 | 0.35 | 0.35 | 0.42 | 0.38 |
| ESP | 0.29 | 0.32 | 0.15 | 0.24 | 0.30 | 0.11 |
| GBR | 0.36 | 0.39 | 0.39 | 0.22 | 0.41 | 0.46 |
| USA | 0.33 | 0.33 | 0.44 | 0.12 | 0.29 | 0.43 |
| JPN | 0.35 | 0.12 | 0.33 | 0.18 | 0.14 | 0.40 |
| KOR | 0.32 | 0.14 | 0.26 | 0.39 | 0.16 | 0.14 |
| MEX | 0.13 | 0.06 | 0.08 | 0.19 | 0.06 | −0.05 |
| VNM | 0.40 | 0.03 | −0.10 | 0.44 | −0.11 | −0.41 |
| Note : The table reports the bilateral product rank correlation. For each country and year, products are ranked according to our structural revealed comparative advantage measure. CHN, China, FRA, France, DEU, Germany, POL, Poland, ITA, Italy, ESP, Spain, GBR, United Kingdom, USA, United States, JPN, Japan, KOR, Korea, MEX, Mexico, VNM, Vietnam. | ||||||
| Source : authors’ computation. | ||||||
The comparison with 2002 reveals how this distinctive pattern emerged. China’s similarity with Germany increased sharply from 0.11 to 0.44, compared with more moderate increases for France (0.22 to 0.33) and Italy (0.35 to 0.44). Meanwhile, its similarity with Vietnam remained high (0.44 in 2002 and 0.40 in 2024), whereas France and Germany remain much less similar to Vietnam. China thus stands out among the three reference countries for its proximity to both advanced industrial economies and lower-cost manufacturing exporters.
4 China’s comparative advantage and European export market shares
The previous section documented the growing similarity between China’s productive specialization and that of advanced economies. We now examine more directly how changes in the international structure of comparative advantage have affected the export performance of European countries at the product level (see methodology in Appendix). Our index of Comparative Advantage Competition measures how changes in bilateral comparative advantage translate into changes in relative export market shares on a given market, everything else equal.14 It therefore indicates which products gained or lost from changes in relative comparative advantage between China and EU countries over different periods.15 We divide the 2002-2024 period into three non-overlapping periods – 2002-2012, 2012-2019 and 2019-2024 – each corresponding to an episode of increasing export market shares and trade surpluses mentioned in the introduction.
14 This index focus on relative market shares and therefore says nothing about the global export market shares of each country.
15 Note that a loss of relative comparative advantage may reflect China’s gains as well as a deterioration on the European side.
16 Note that the 2002-2012 period is twice as long as 2019-2024.
We first assess whether China’s convergence in comparative advantage has been concentrated in products that account for a large share of Western countries’ exports by taking the weighted average of our index of Comparative Advantage Competition (Figure 2). The broad picture shows that losses in comparative advantages relative to China have, on average, been concentrated on important export products over all periods. The weighted export market shares losses have been particularly important over 2002-2012 and 2019-2024 for most countries.16
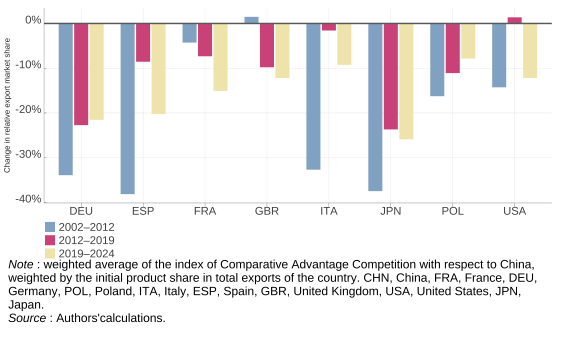
Exposure however differs across countries and over time. Germany and Japan lost comparative advantage relative to China in their main exported products in all three periods. Over 2019-2024, Japan, Germany and Spain experienced the largest losses in comparative advantage relative to China in their key export products. France stands out for the steady rise in competitive pressure from China on its main exports, from almost nothing in 2002-2012. The United Kingdom shows a similar build-up since 2012.
These aggregate results therefore point to a similar pattern across the first and second China shocks: China’s convergence in comparative advantage has been concentrated in products that matter most for Western countries’ exports. Yet the nature of this competition has changed over time. To understand this shift more precisely, we now distinguish between technology-intensive and more traditional industries (Figure 3).17 The contrast between the three periods is striking. Between 2002 and 2012, changes in comparative advantage relative to China actually favored the high-tech exports of France, Germany, Italy and especially Poland. The pressure from China’s changing specialization fell on lower- and medium-technology products.
17 We use Eurostat classification of high tech products https://ec.europa.eu/eurostat/statistics-explained/images/1/1d/High_tech_product_codes.pdf
The pattern then reverses for the euro-area economies: high-tech products bear the brunt of China’s convergence after 2012 for Germany, and after 2019 for France and Italy. Spain, already exposed in high-tech products during the first period, remains so. Over 2019-2024, France is the most affected, followed by Germany, Italy and Spain. For these economies, the competitive challenge from China has shifted from traditional manufacturing towards the technology-intensive products where they once held their strongest positions.
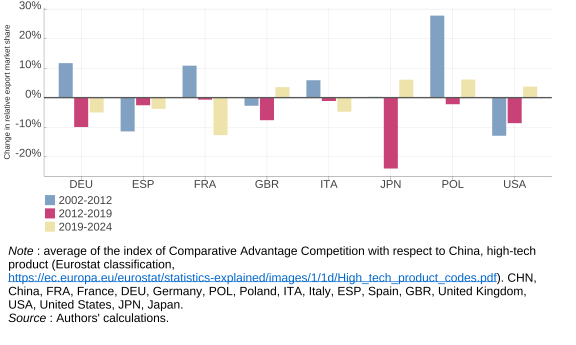
This shift is not universal, however. The United States and the United Kingdom already faced China-driven pressure on their high-tech products during 2002–2012, as did Japan over 2012–2019. Over 2019–2024, all four of the US, the UK, Japan and Poland gained relative comparative advantage over China in high-tech products. The high-tech dimension of the second China shock therefore appears specific to the four largest euro area economies in our sample.
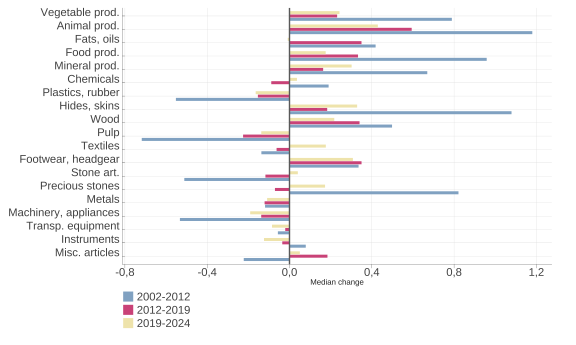
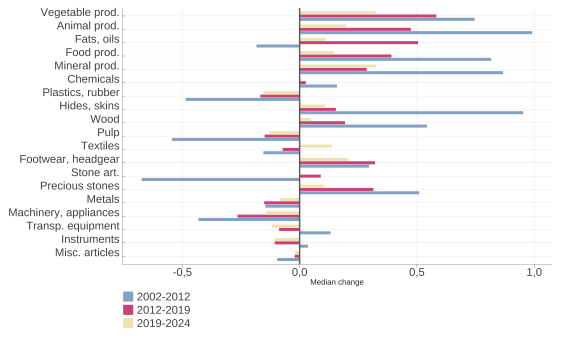
China’s competitive pressure also varies considerably across sectors and products over the whole period (Appendix Figure A.2 and A.3 for France and Germany). For both countries, over 2019-2024, CA-driven competition from China is concentrated in instruments, machinery and appliance, metals, plastic rubber and pulp, while change in comparative advantage remains positive in animal, food and vegetable products, footwear, mineral products and textiles. For transport equipment, the picture is mixed with decreasing export market shares on automotive products but increasing market shares for aeronautics products.
Even within narrowly defined sectors, outcomes may vary considerably across products. The railways sector provides an interesting illustration. For France over 2019-2024, some railway products appear among those with the largest gains (« Railway or tramway goods vans and wagons; self-discharging, not self-propelled » or « Rail locomotives; powered by electric accumulators ») while others rank among those with the largest losses (« Railway or tramway goods vans and wagons; tank wagons and the like, not self-propelled » or « Railway or tramway coaches, vans and trucks; self-propelled, powered from an external source of electricity »). Chinese competition needs therefore to be assessed at the detailed product-level.
5 Competition from other countries
We now zoom out from competition with China to look at competition from other countries. We focus on France and Germany and compare CA-driven changes in their weighted export market share evolution, relative to other advanced economies (Figure 4a and 4b).
For Germany, China has been the main source of CA-driven competitive pressure on its most exported products since 2012, and was already a major source before then. Over 2002–2012, however, pressure from Poland was more focused on German largest exported products, which reflects the integration of Central European economies into German value chains. Over 2019-2024, Poland and the United States rank next, well behind China.
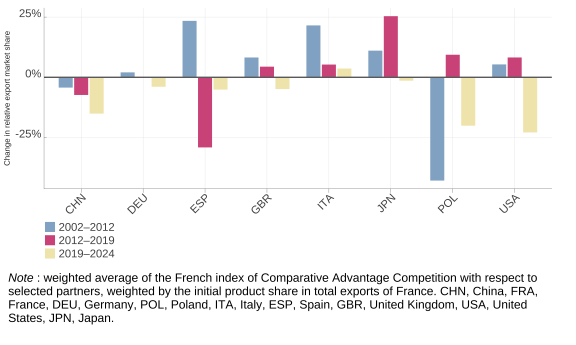
For France, other countries than China played a key role in CA-driven competitive pressure on its most exported products. Over 2019–2024, the change in comparative advantage relative to the United States and Poland weighed more directly on France’s key exports than those relative to China. Over 2012-2019, the main pressure came from Spain, and over 2002–2012 from Poland, while the effect of China was small. By contrast, changes relative to Italy and, until 2019, Japan, the UK and the US have been favorable to France.
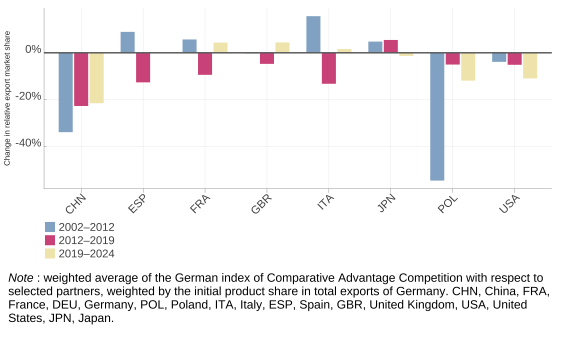
The two largest European economies therefore face very different situations. For Germany, China has been the main competitive challenge to its specialization since 2012. For France, China is one important challenger among several.
6 Conclusion
China’s convergence with the specialization patterns of advanced economies appears to be largely a long-running process, already largely visible in the decade following China’s WTO accession. The second China shock differs less in its scale than in the type of products it affects. Since 2012 for Germany and since 2019 for France and Italy, the losses of comparative advantage relative to China have been increasingly concentrated on high-tech products, the core of Europe’s industrial strength. This shift is mainly confined to the euro area countries in our sample. Exposure also varies widely across countries. China is the dominant challenger for Germany, but in France, changes in comparative advantage relative to the United States and Poland have also recently weighed on key exports. Maintaining a unified EU position is all the more difficult under diverging exposures.
This is a structural issue, not a side effect of China’s trade imbalances. Even if China’s surplus were to shrink, EU countries would continue to compete directly with China in a growing share of the products at the core of their specialization. The trade surplus magnifies this competition, but it does not define it. In a context of great-power rivalry, the stakes go beyond the impact on local labor markets, and extend, depending on the products affected, to strategic dependencies and technological sovereignty.
Our results point to the product-specific nature of Chinese competition, calling for targeted rather than broad-based measures. Trade defence has a role to play, but it cannot by itself restore eroded comparative advantages or address competitive pressures faced by European exporters in third markets. Nor should the response focus on China alone: for France, other advanced economies also exert significant pressure on key exports. China built its positions in strategic sectors such as batteries, solar panels or electric vehicles through sustained and selective industrial policies, illustrating how public policy can contribute to shaping comparative advantage. The EU should also draw lessons from China’s experience combining defensive measures and active industrial policies, and identify which comparative advantages it wants to consolidate and develop for the future.
Références
Aprigliano V., Bencivelli L., Borin A., Conteduca F.P., Corsello F., Federico S., Giordano C., Leone F., Mancini M., Panon L., Patrignani L., Pica S. (2026). “China Shock 2.0: Structural drivers and implications for the euro area,” Occasional Papers, 1025, Bank of Italy.
Autor D.H., Dorn D., Hanson G.H. (2013). “The China syndrome: Local labor market effects of import competition in the United States,” American Economic Review, 103, n° 6, pp. 2121–2168.
Chowdhry S., Erhardt K., Hinz J. (2026). “Competing with China in third markets,” Kiel Policy Brief, 213, Kiel Institute for the World Economy.
Costinot A., Donaldson D., Komunjer I. (2012). “What goods do countries trade? A quantitative exploration of Ricardo’s ideas,” The Review of Economic Studies, 79, n° 2, pp. 581–608.
Eaton J., Kortum S. (2002). “Technology, geography, and trade,” Econometrica, 70, n° 5, pp. 1741–1779.
Emlinger C., Mejean I., Lefebvre K., Vicard V. (2026). “EU under pressure? Exploring Chinese trade deflection,” dans Rey H., Weder di Mauro B., Zettelmeyer J. (eds.), Paris report 4: The new global imbalances, CEPR Press, Paris; London.
Gaure S. (2013). “OLS with multiple high dimensional category variables,” Computational Statistics and Data Analysis, 66, pp. 8–18.
Giovanni J. di, Levchenko A.A., Zhang J. (2014). “The global welfare impact of China: Trade integration and technological change,” American Economic Journal: Macroeconomics, 6, n° 3, pp. 153–183.
Jean S. (2026). “Global imbalances, industrial policies, and the challenge of surging Chinese trade surpluses,” dans Rey H., Weder di Mauro B., Zettelmeyer J. (eds.), Paris report 4: The new global imbalances, CEPR Press.
Leromain E., Orefice G. (2014). “New revealed comparative advantage index: Dataset and empirical distribution,” International Economics, 139, pp. 48–70.
Setser B., Peters B. (2026). “China’s customs-BOP gap is not a customs problem,” Follow the Money.
Soyres F. de, Fisgin E., Santacreu A.M., Van Leemput E., Vega K. (2026). “China shock 2.0: How China’s ongoing export surge differs from the early 2000s,” FEDS Notes.
Tordoir S., Setser B. (2026). “China shock 2.0: The cost of Germany’s complacency,” Policy Brief, Centre for European Reform.
7 Appendix
7.1 China trade surplus and export market share
7.2 France and Germany: median comparative advantage evolution by section
19 United States, Germany, France, Great Britain, Italy, China, Netherlands, Belgium, Spain, South Africa, India, Austria, Japan, Sweden, Canada, Czech Republic, Denmark, Poland, Australia, Switzerland.
18 Its value has no impact on the measure as it doesn’t vary across products.
Reuse
Citation
BibTeX citation:
@article{emlinger2026,
  author = {Emlinger, Charlotte and Keller, Simon and Vicard, Vincent},
  title = {Converging {Comparative} {Advantages:} {EU’s} {Second}
    {China} {Shock}},
  journal = {Policy Brief de l’IFE},
  number = {1},
  date = {2026-11-02},
  url = {https://www.ofce.fr/pb/ife/1/},
  langid = {en},
  abstract = {China’s €1 trillion trade surplus in 2025 has revived
    fears of a second China shock in the EU. Using bilateral
    product-level trade data for 2002–2024, we estimate structural
    revealed comparative advantages to investigate whether China’s
    specialization is converging toward that of advanced economies.
    Convergence is a long-running process, largely under way in the
    decade following China’s accession to the WTO. The second shock
    differs less in its scale than in its composition. Since 2012 for
    Germany, and since 2019 for France and Italy, losses of comparative
    advantage relative to China have been increasingly concentrated in
    high-tech products. This shift is confined to the large euro-area
    economies, while the US, the UK, Japan and Poland have recently
    gained ground. Exposure also differs by country: China is Germany’s
    main competitor, whereas for France, changes relative to the US and
    Poland have also weighed recently. This convergence is structural
    and would persist even if China’s surplus shrank, and uneven
    exposure across member states makes a unified EU response harder.}
}
For attribution, please cite this work as:
Emlinger C., Keller S., Vicard V. (2026). « Converging Comparative Advantages:
EU’s Second China Shock », Policy Brief de l’IFE, n°
1.