Annexes
1 Data appendix
| Variables | Sources |
|---|---|
| GDP & productive capacity | |
| GDP | GMD |
| Potential GDP | WEO |
| Labour market outcomes | |
| Older worker labour force participation rate (55-64) | OECD |
| Total labour force participation rate | CPDS |
| Unemployment rate | GMD |
| Consumption & savings | |
| Consumption | GMD |
| Gross domestic savings | WDI |
| Gross savings | WDI |
| Investment | |
| Investment | GMD |
| Fixed investment | GMD |
| Government debt & fiscal space | |
| Public pension expenditure | OECD (SOCX) |
| Central government expenditure | GMD |
| General government expenditure | GMD |
| Central government debt | IMF (GDD) |
| General government debt | IMF (GDD) |
| External sector | |
| Exports | GMD |
| Imports | GMD |
| Trade balance | GMD |
| Current account balance | GMD |
| Productivity | |
| Total factor productivity | PWT |
| GDP per worker (constant USD) | GMD & CPDS |
| Control variables | |
| Old age dependency ratio | WDI |
| Crisis dummy | GMD |
GMD: Global Macro Database (Müller, Xu, Lehbib, & Chen, 2025)
WEO: World Economic Outlook (IMF)
CPDS: Comparative Political Data Set (Armingeon, Engler, Leemann, & Weisstanner, 2025)
WDI: World Development Indicators (World Bank)
SOCX: Social Expenditure Database (OECD)
GDD: Global Debt Database (IMF)
PWT: Penn World Table (version 10.01) (Feenstra, Inklaar, & Timmer, 2015)
2 Additional results
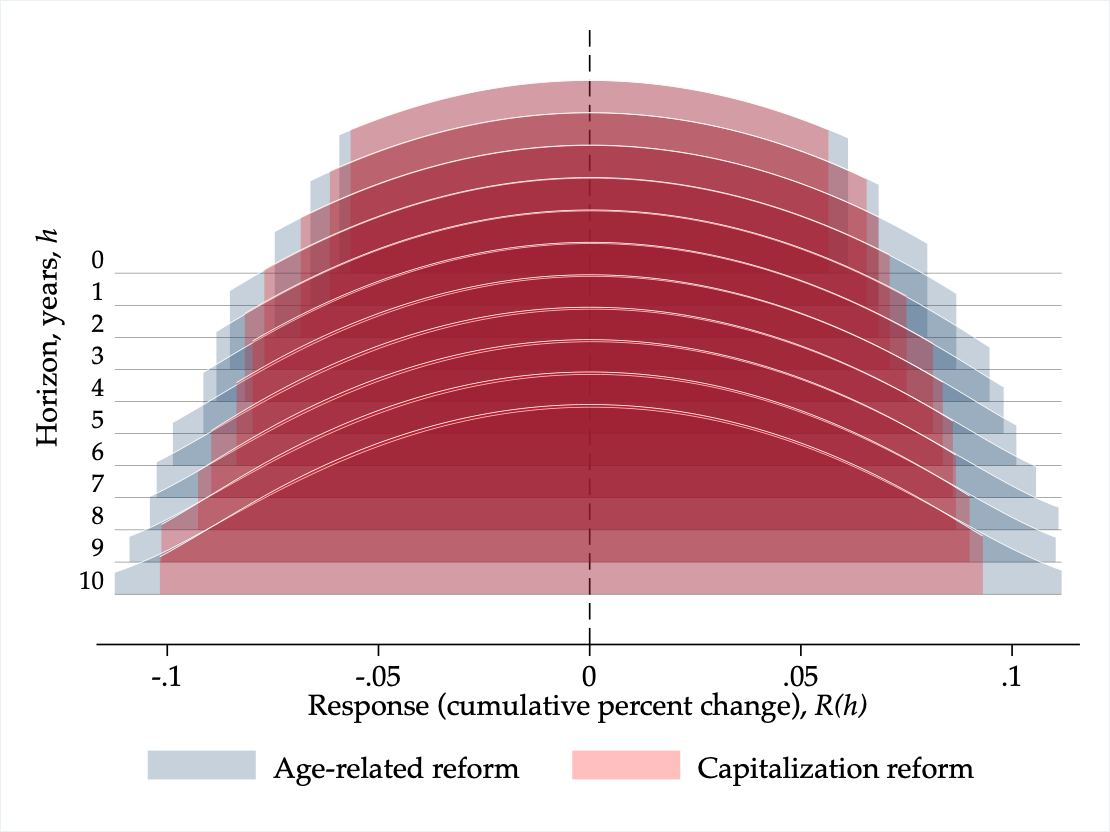
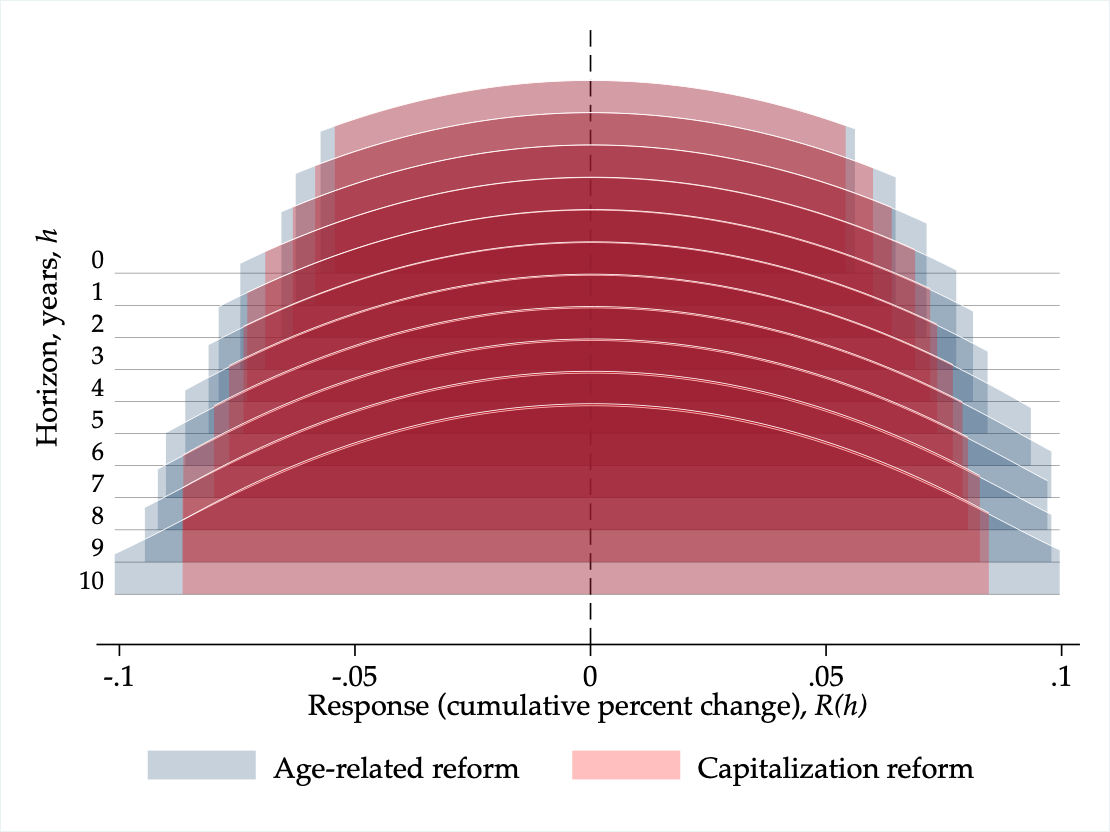
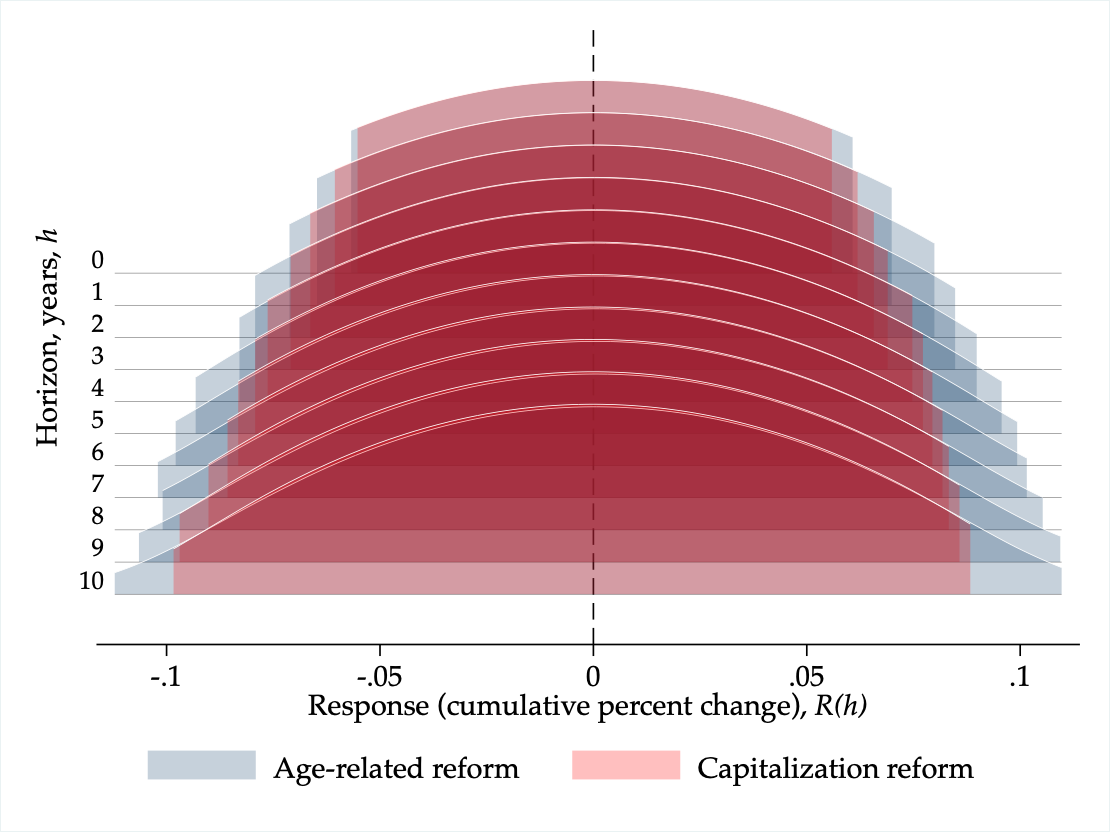
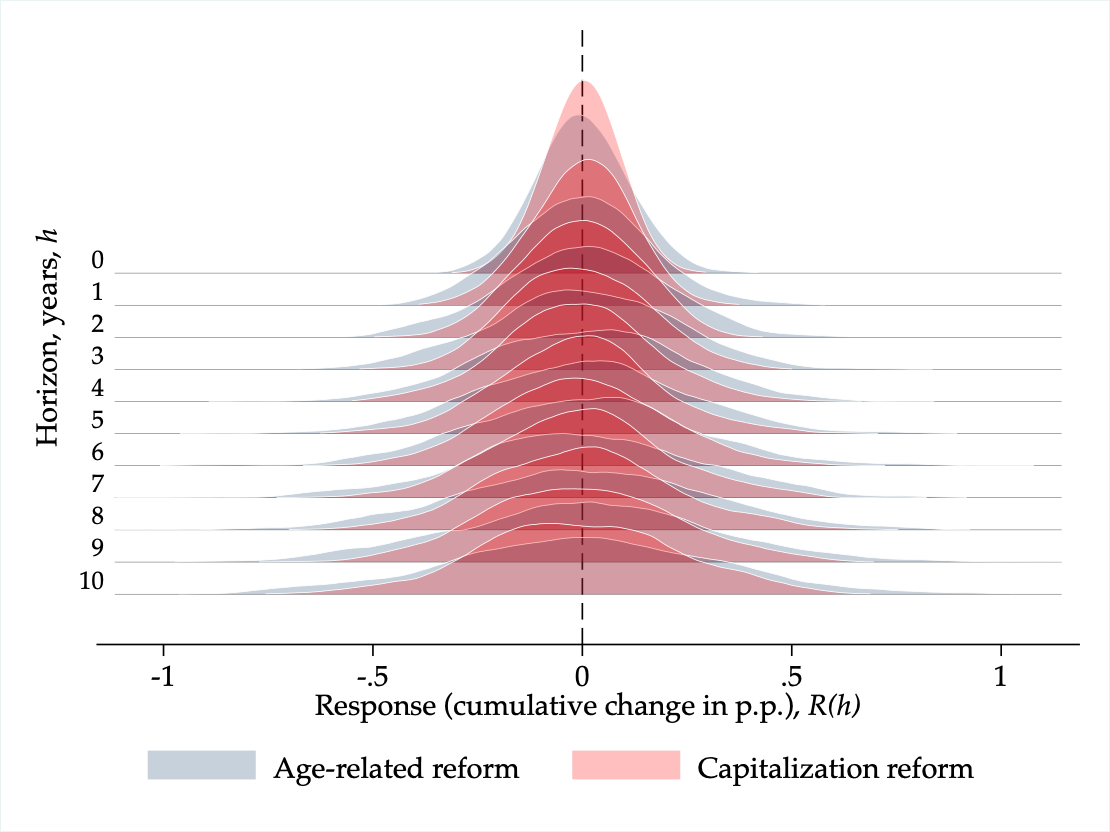
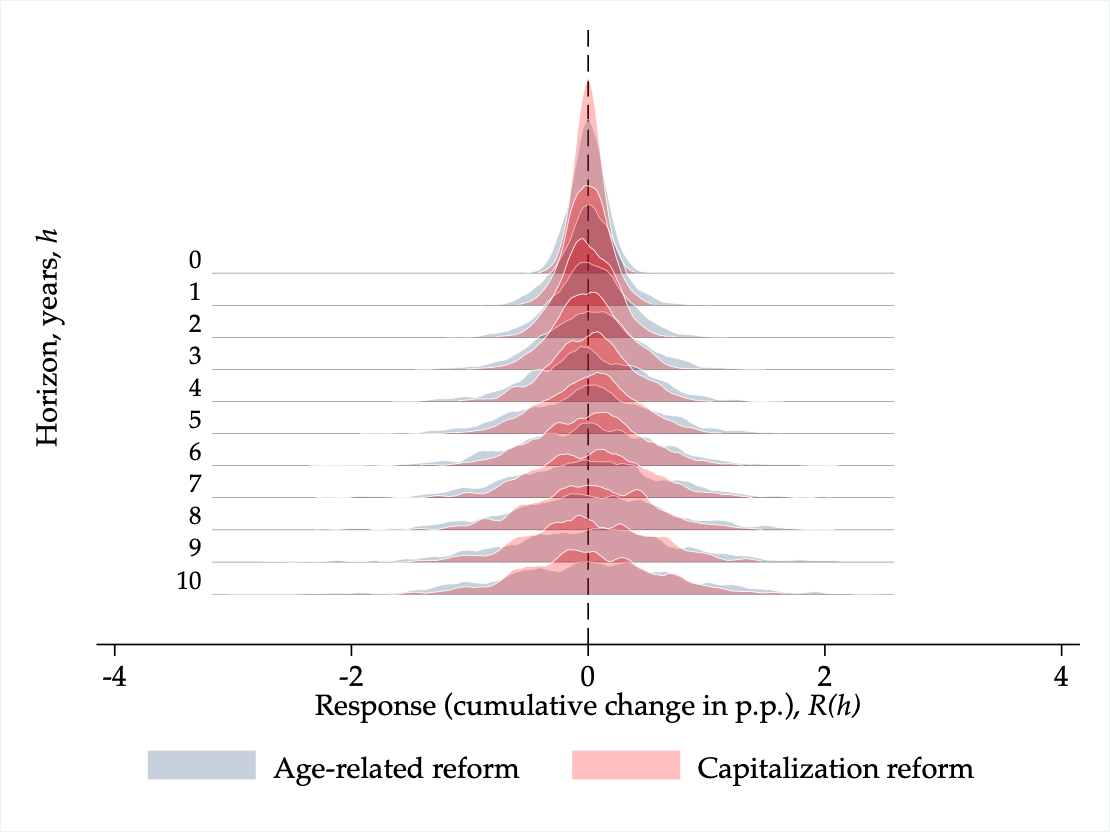
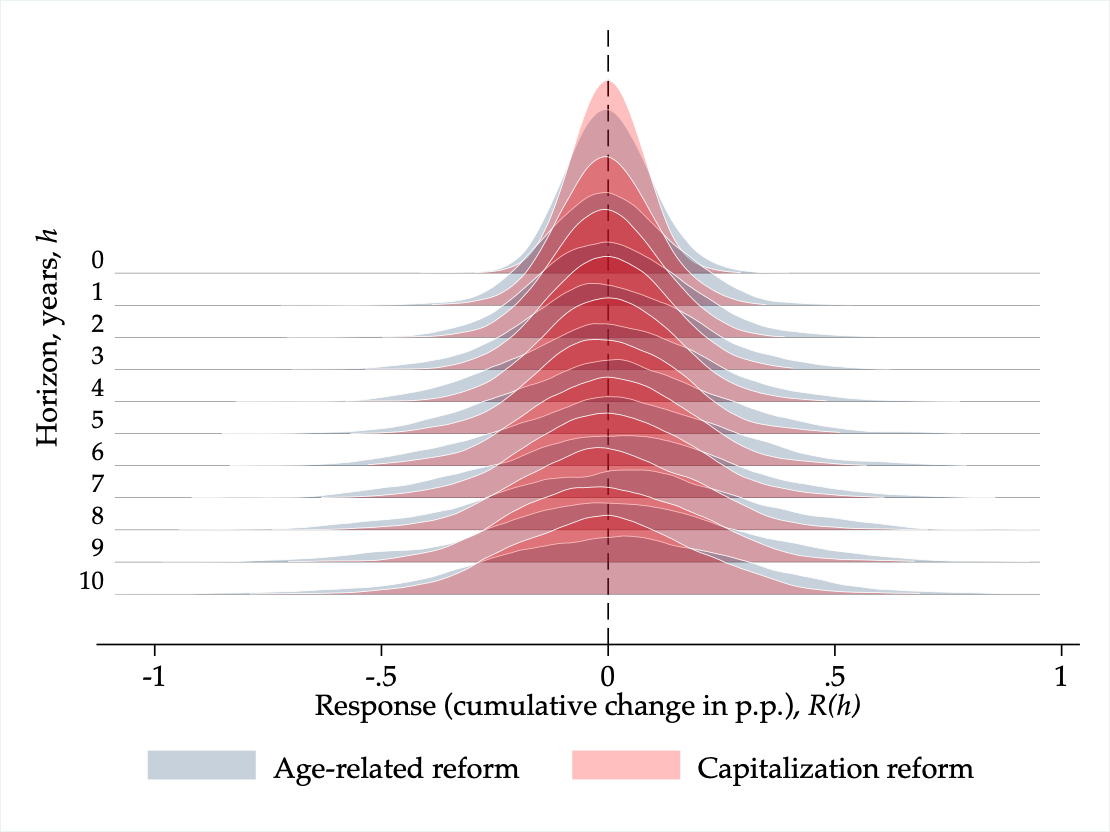
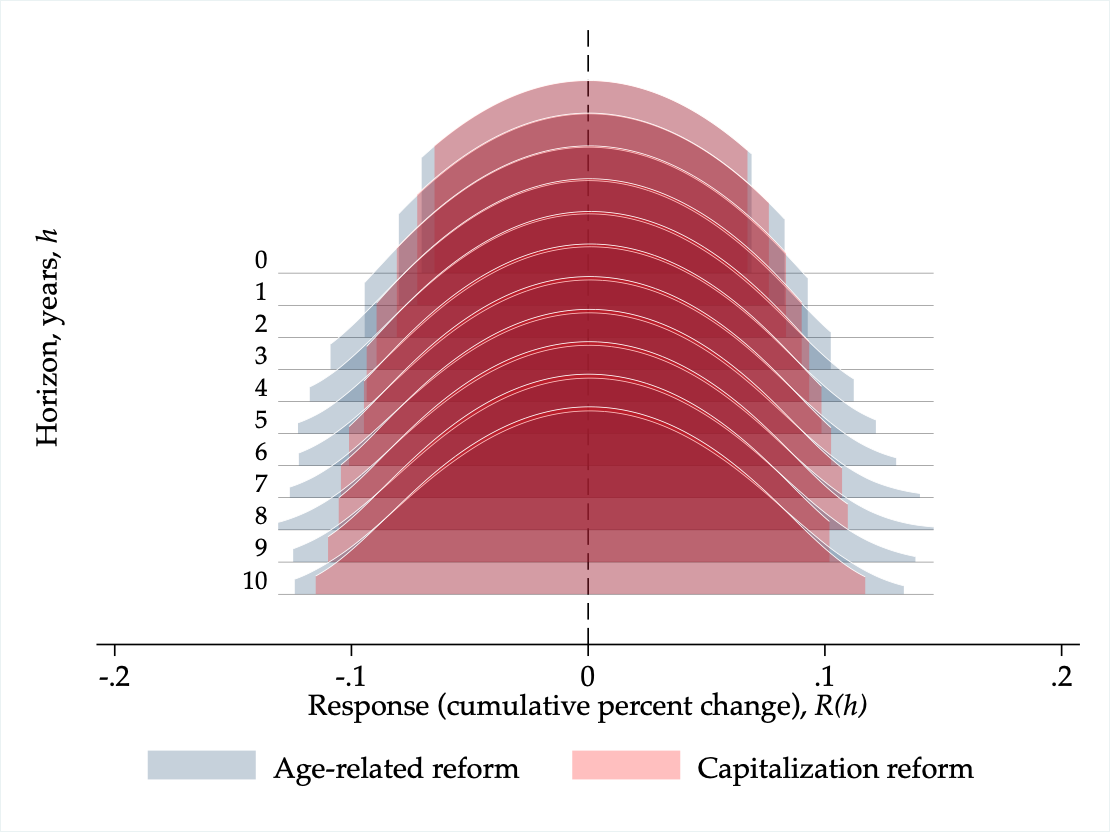
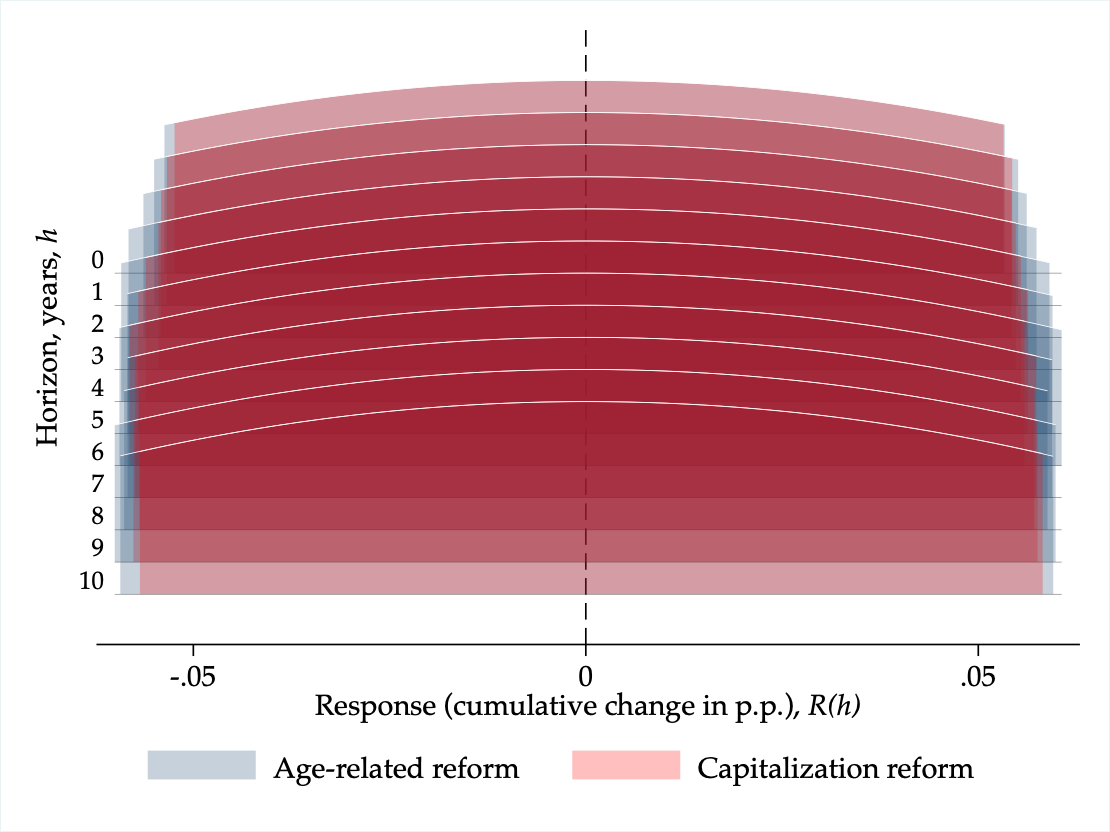
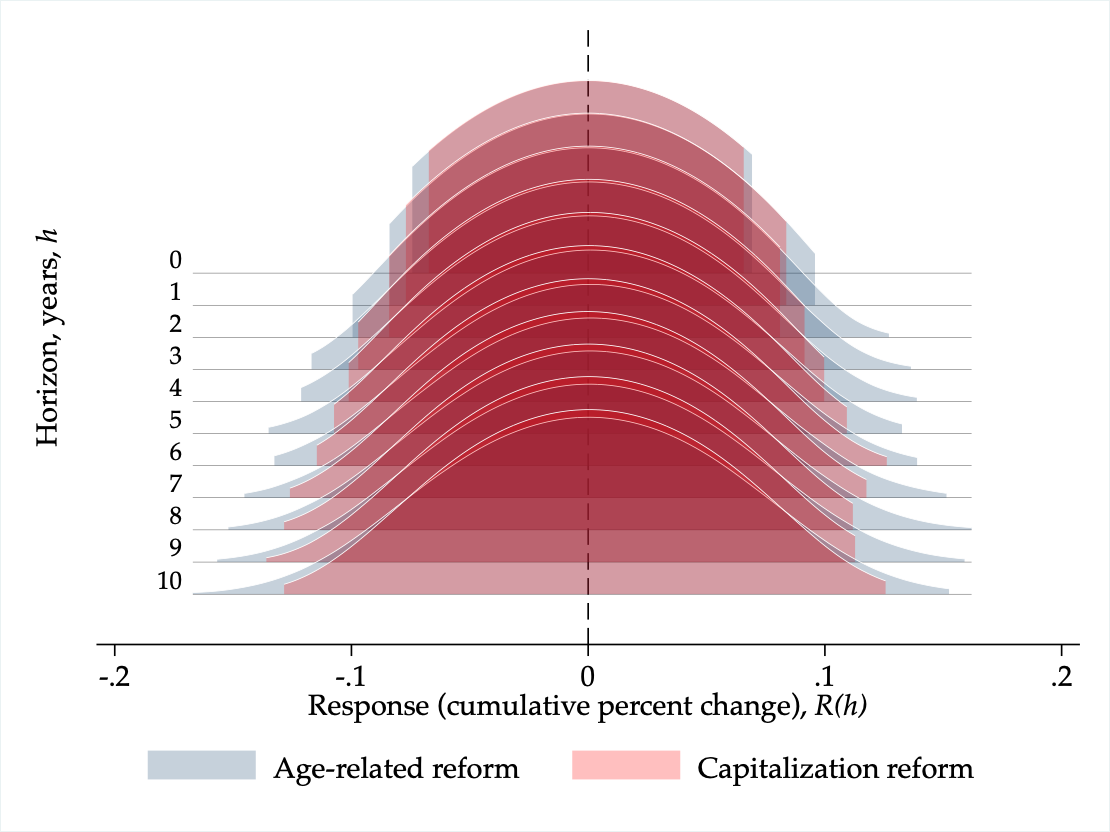
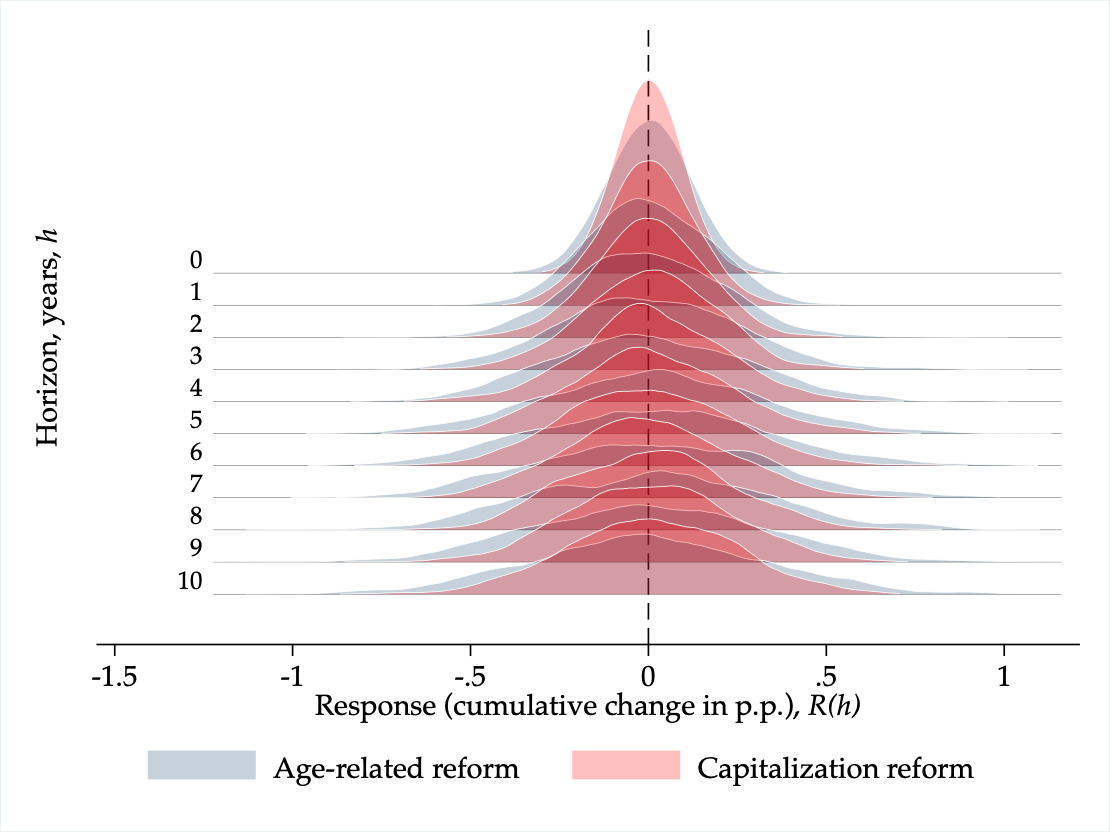
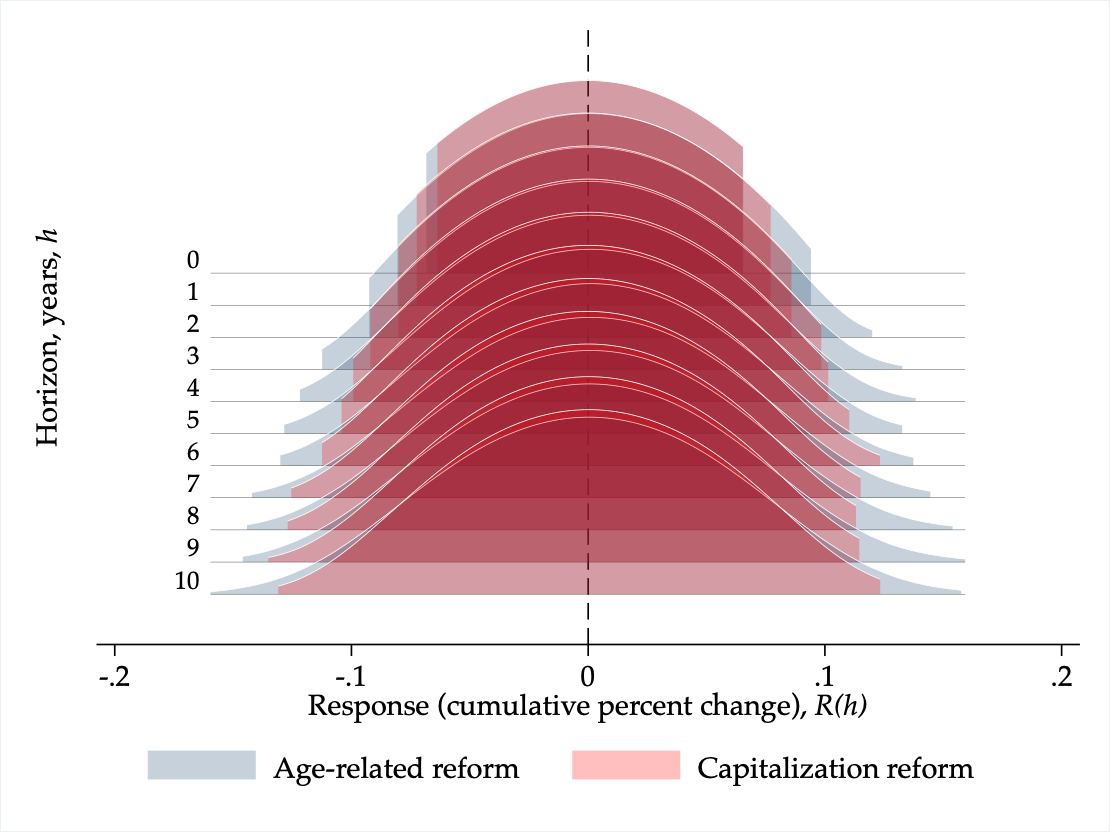
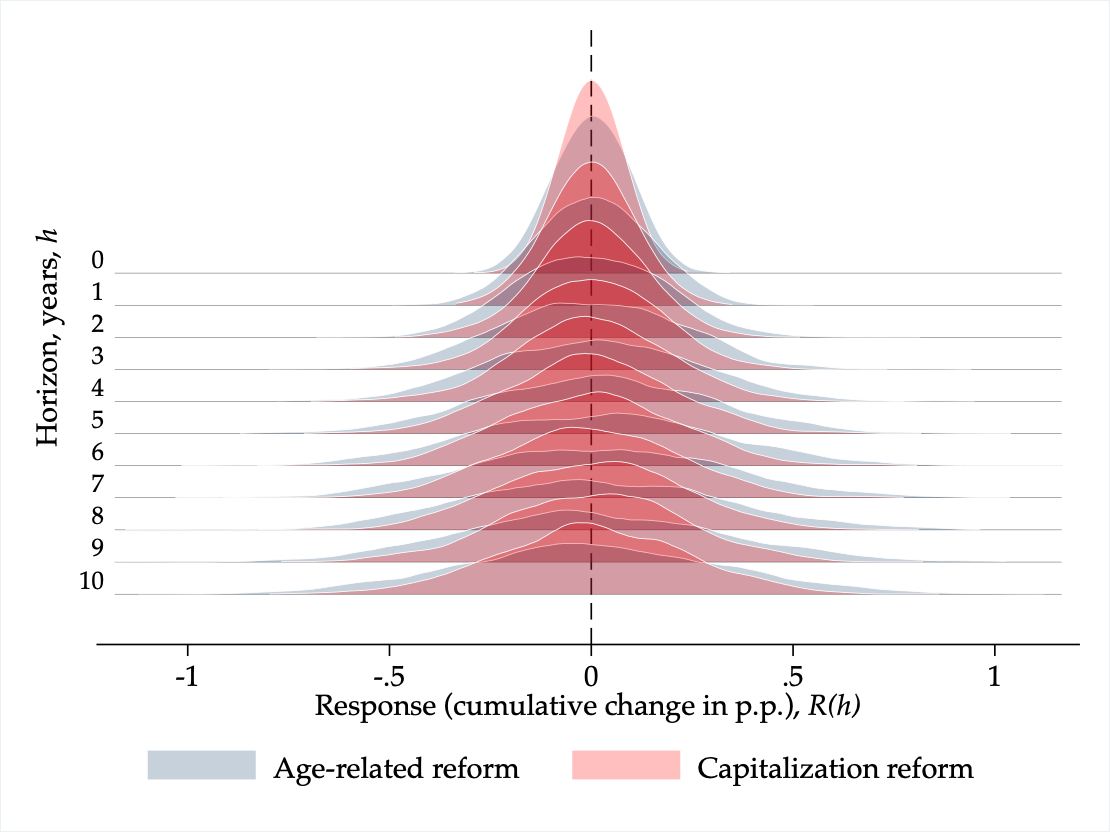
Notes: The figure reports the empirical distributions of impulse responses obtained by randomly permuting reforms across country-year observations and re-estimating the local projections (1000 replications). Each distribution corresponds to one projection horizon. Blue densities refer to responses associated with the Age reforms and red densities to responses associated with the Capitalisation reforms. The placebo distributions provide an empirical benchmark for assessing whether random reform timing generates systematic dynamic responses. LFPR denotes labour force participation rate.
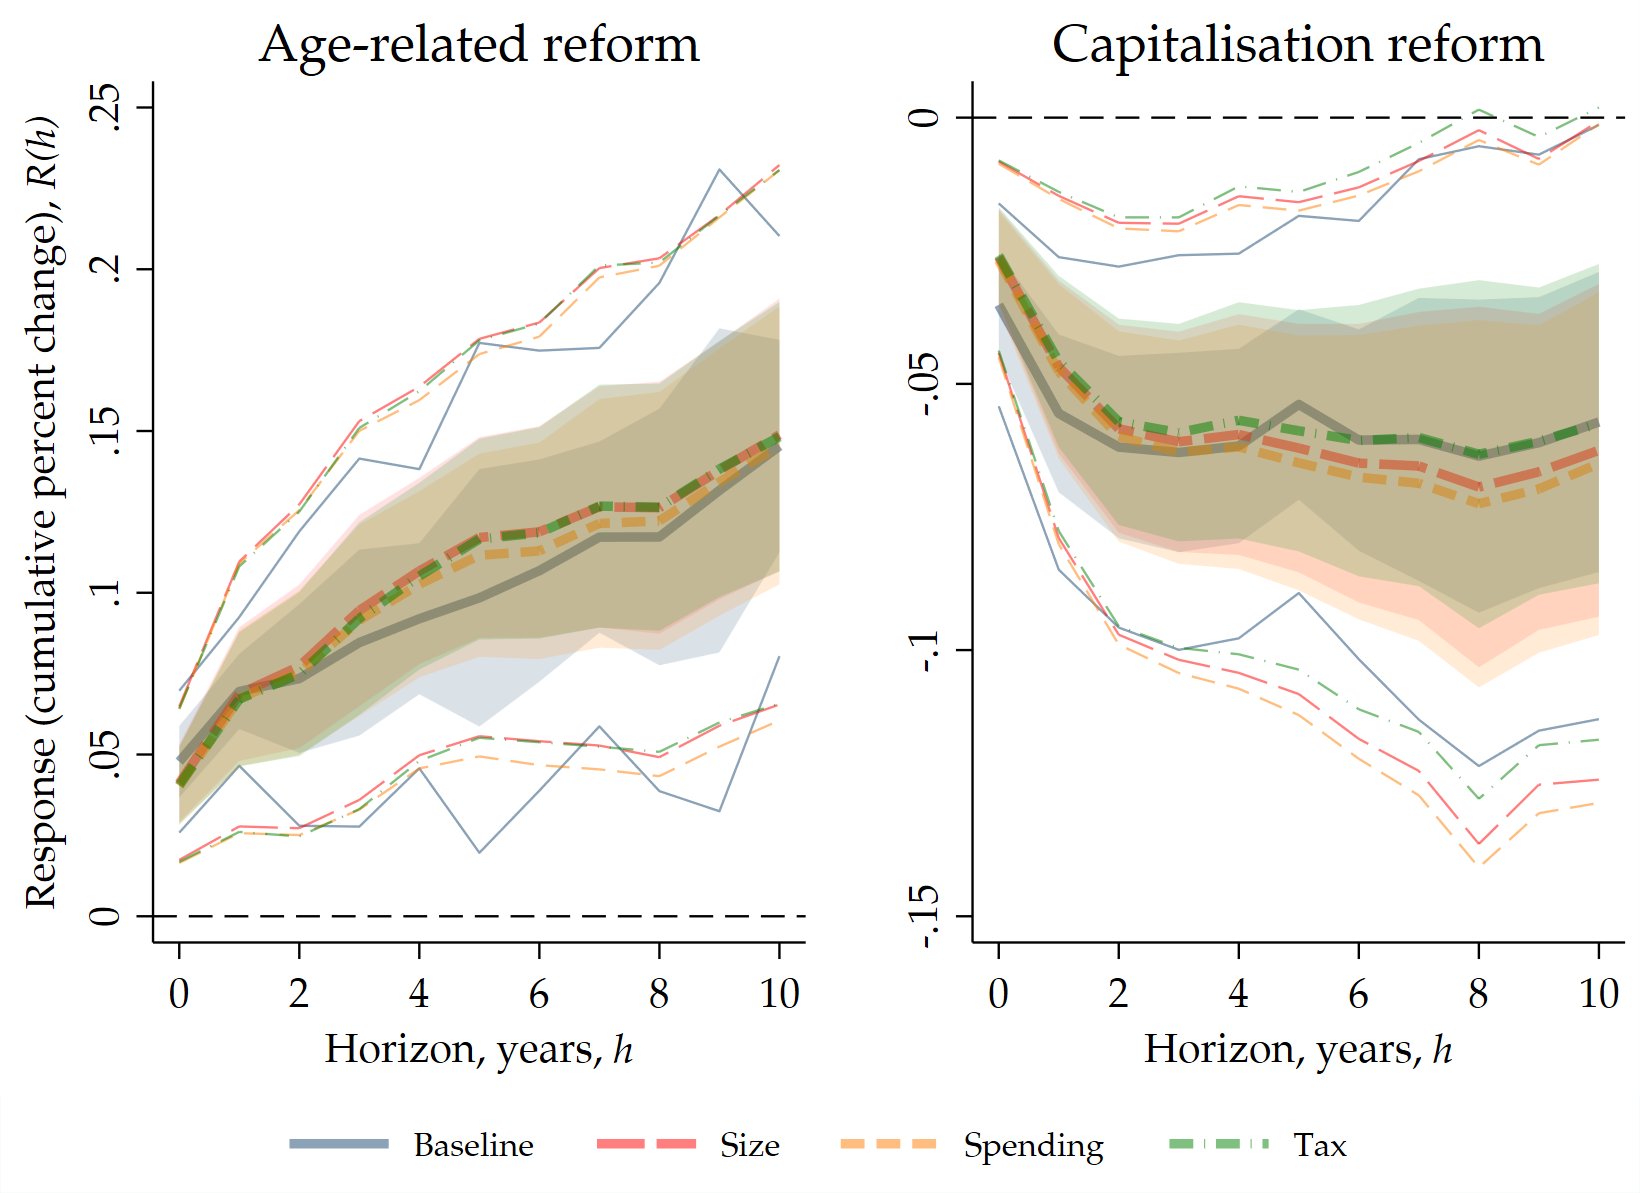
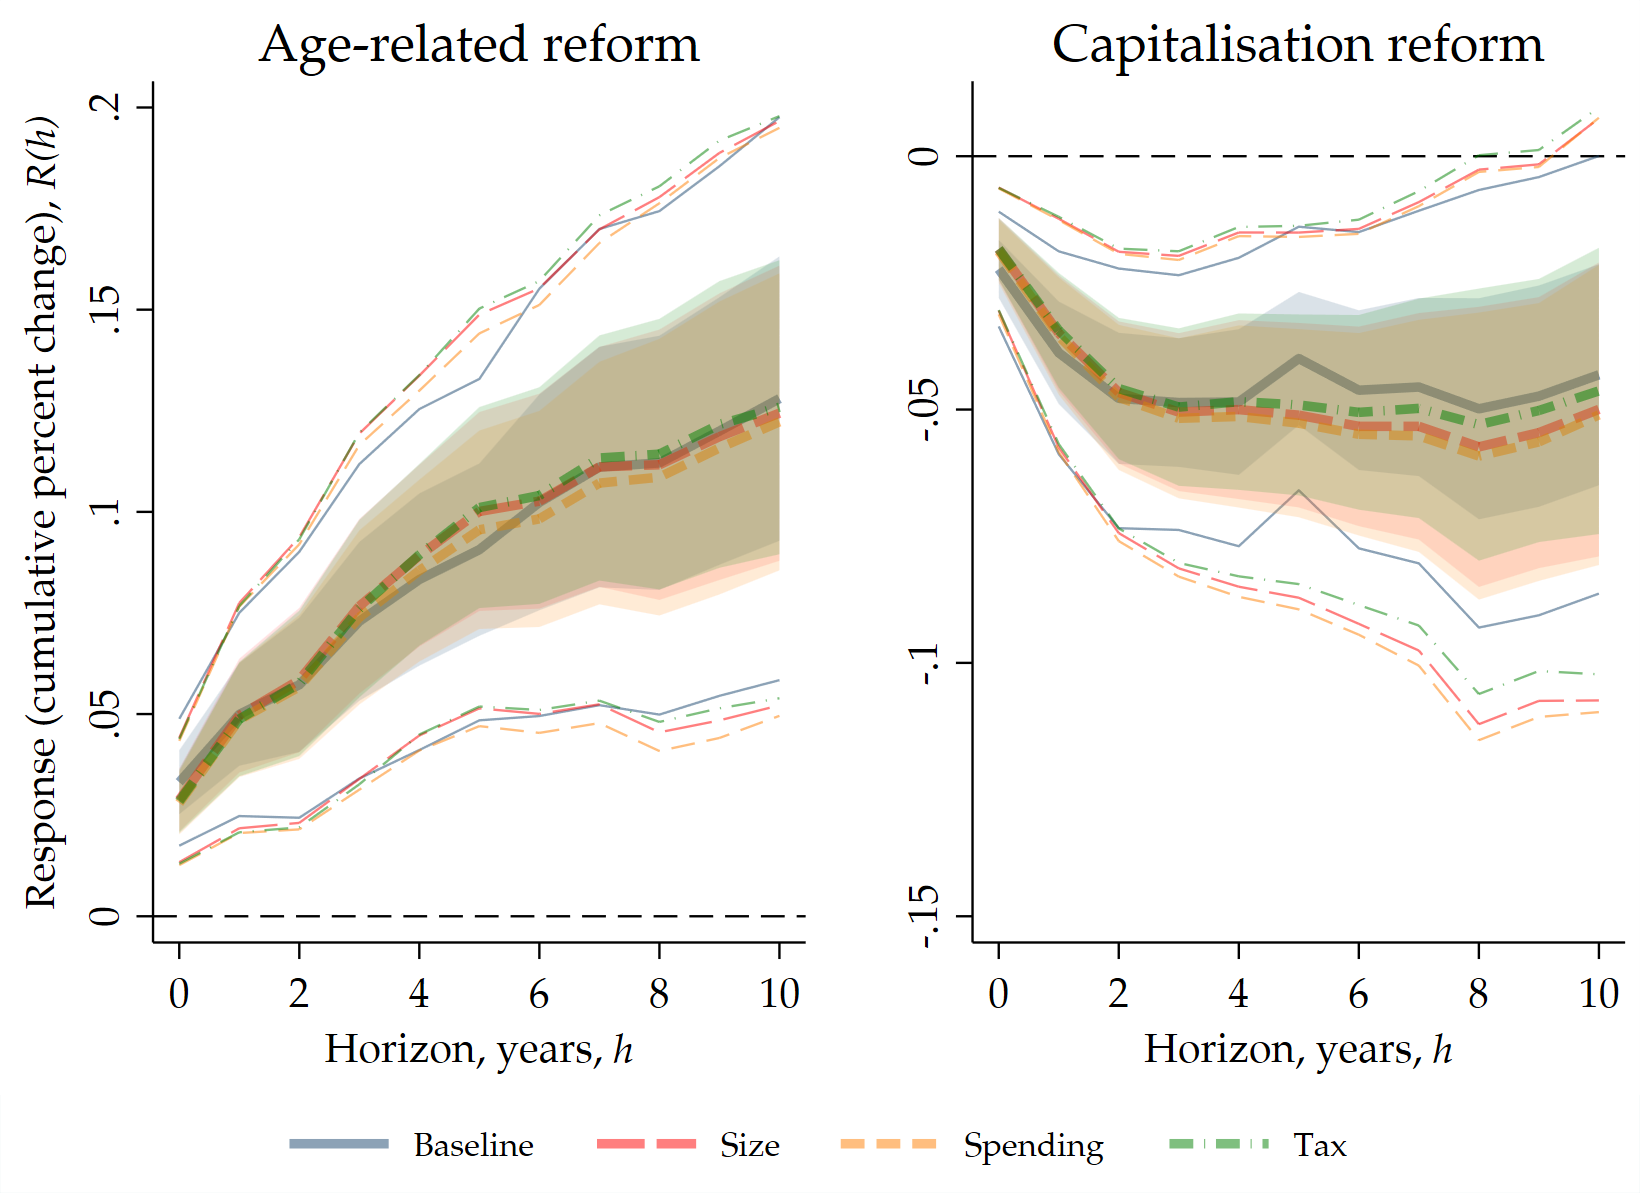
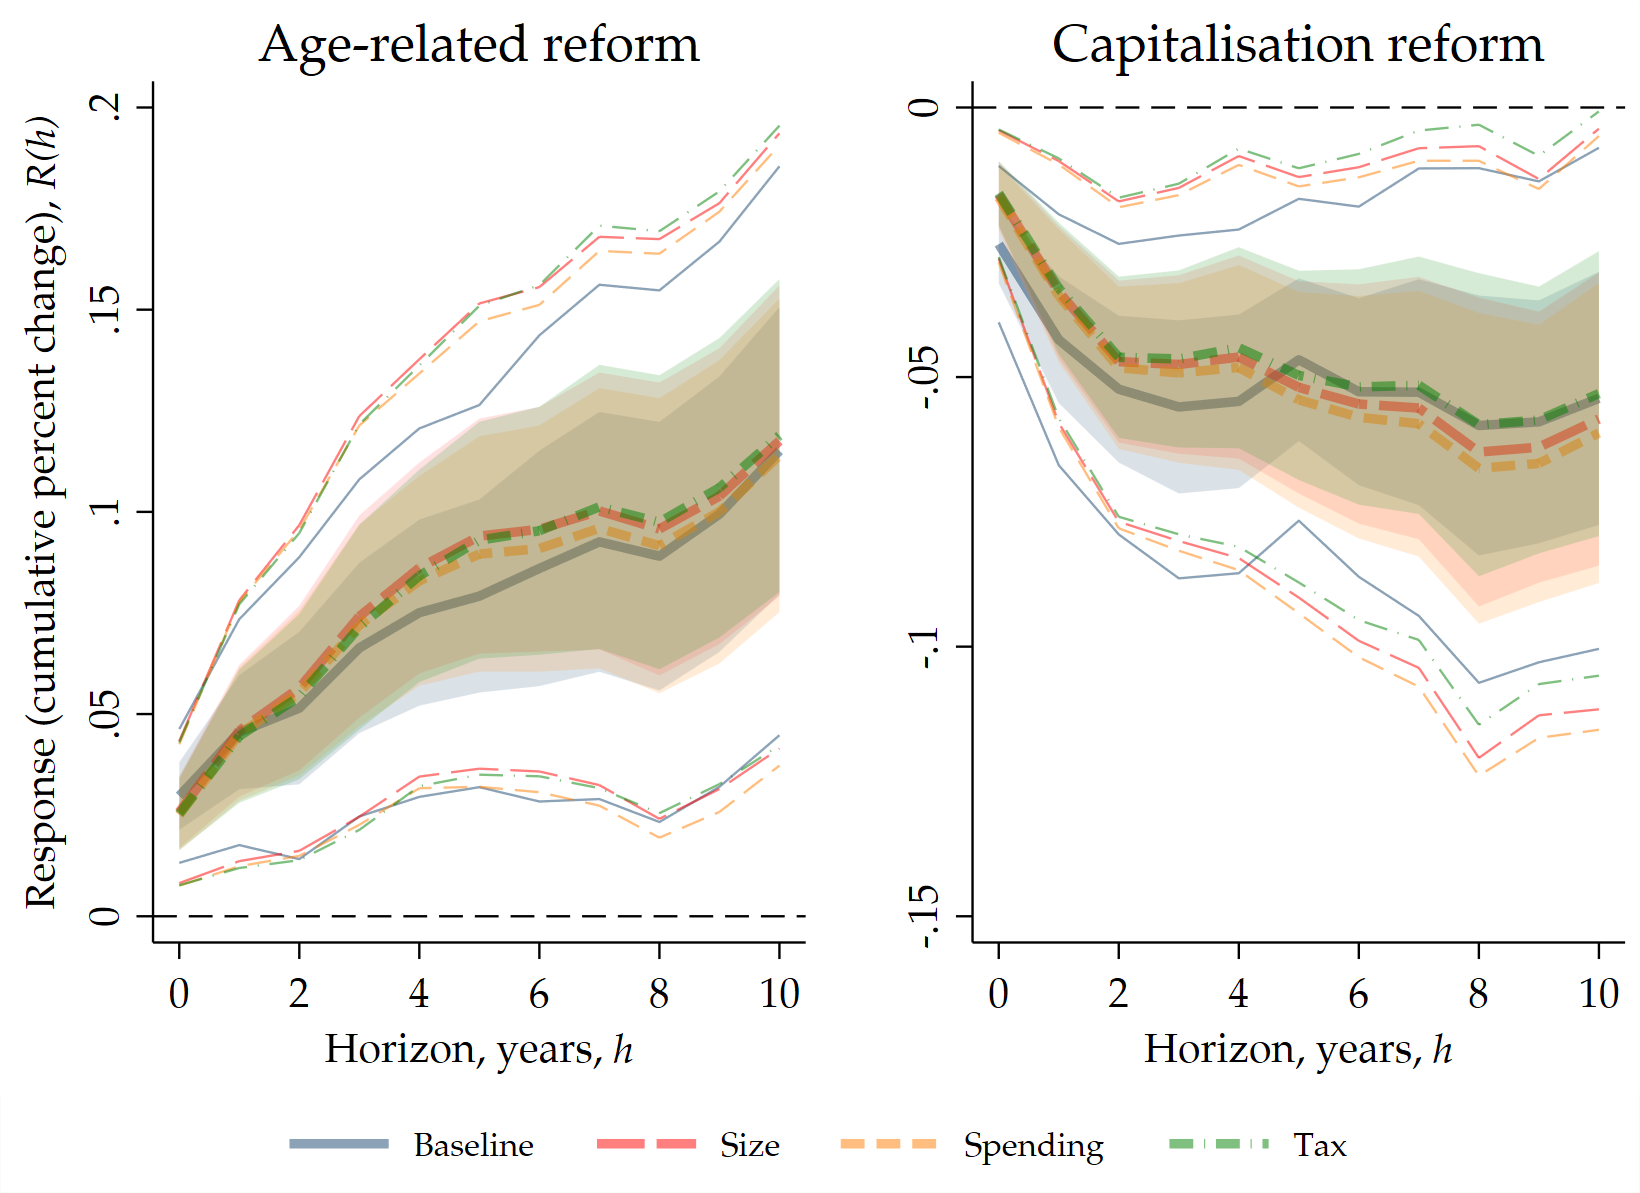
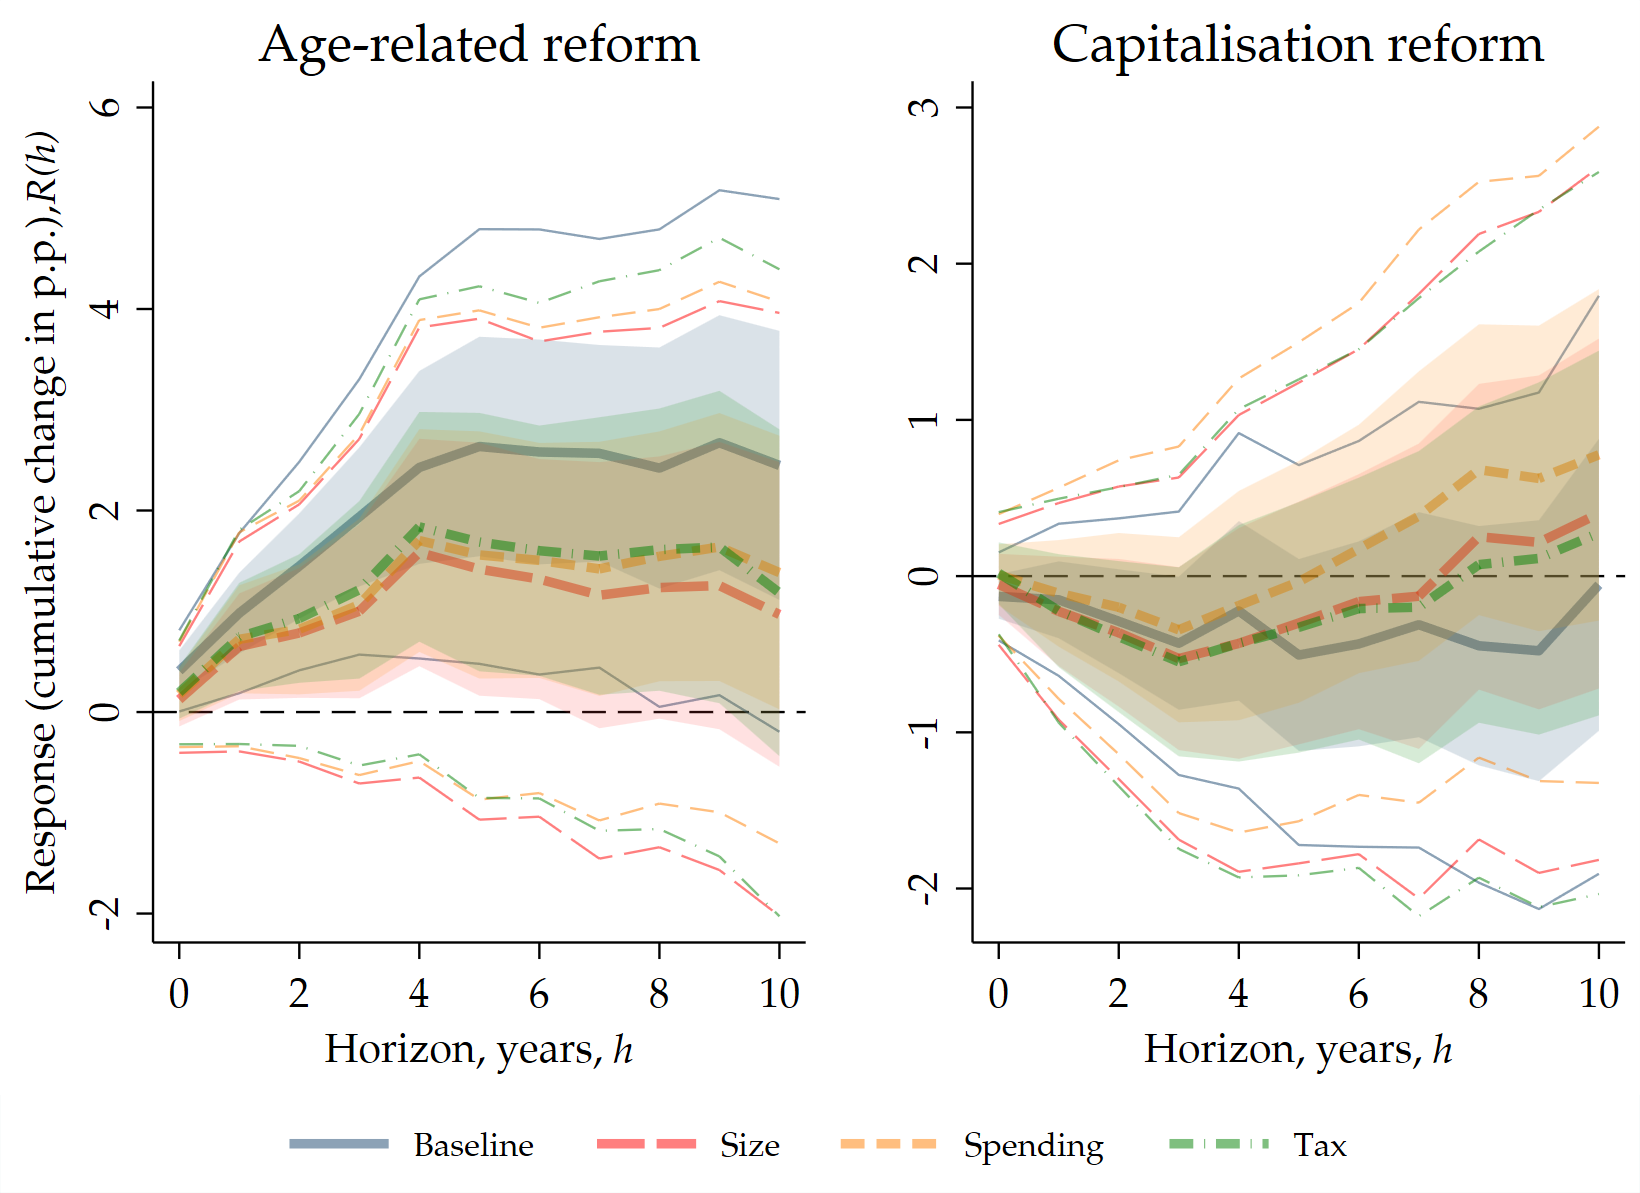
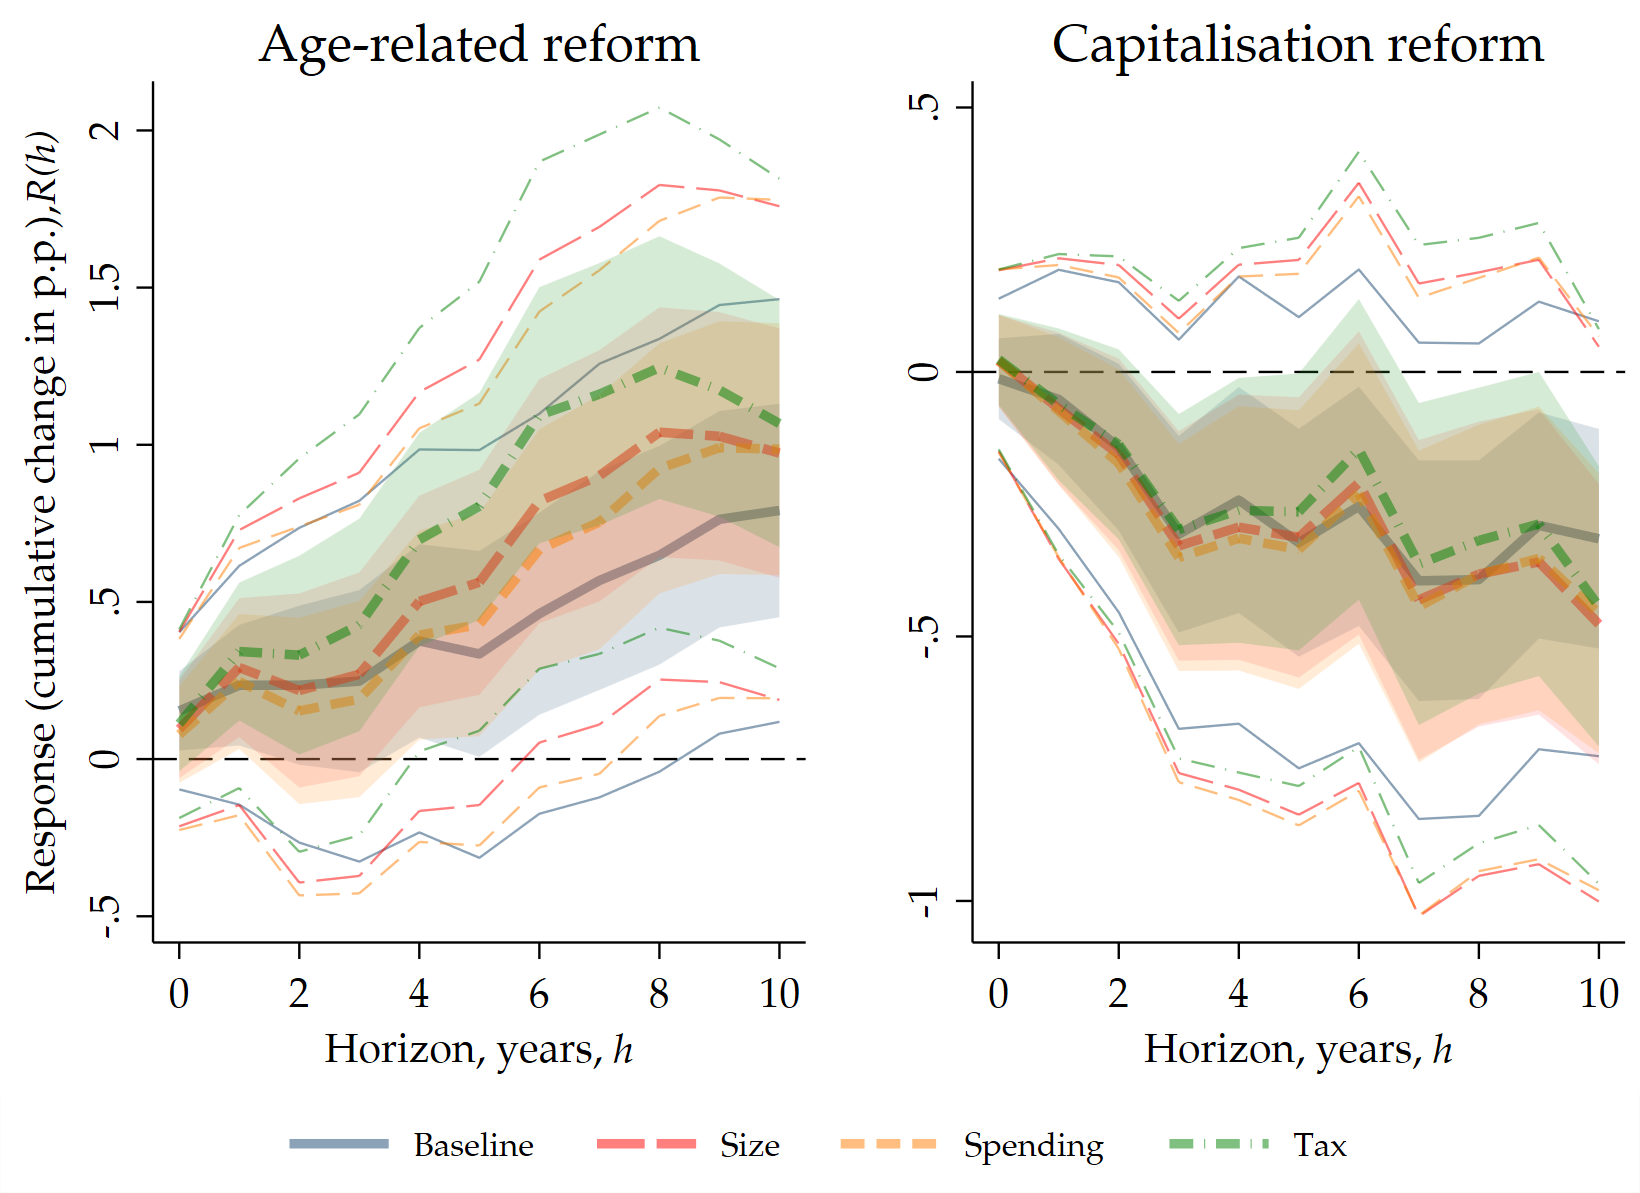
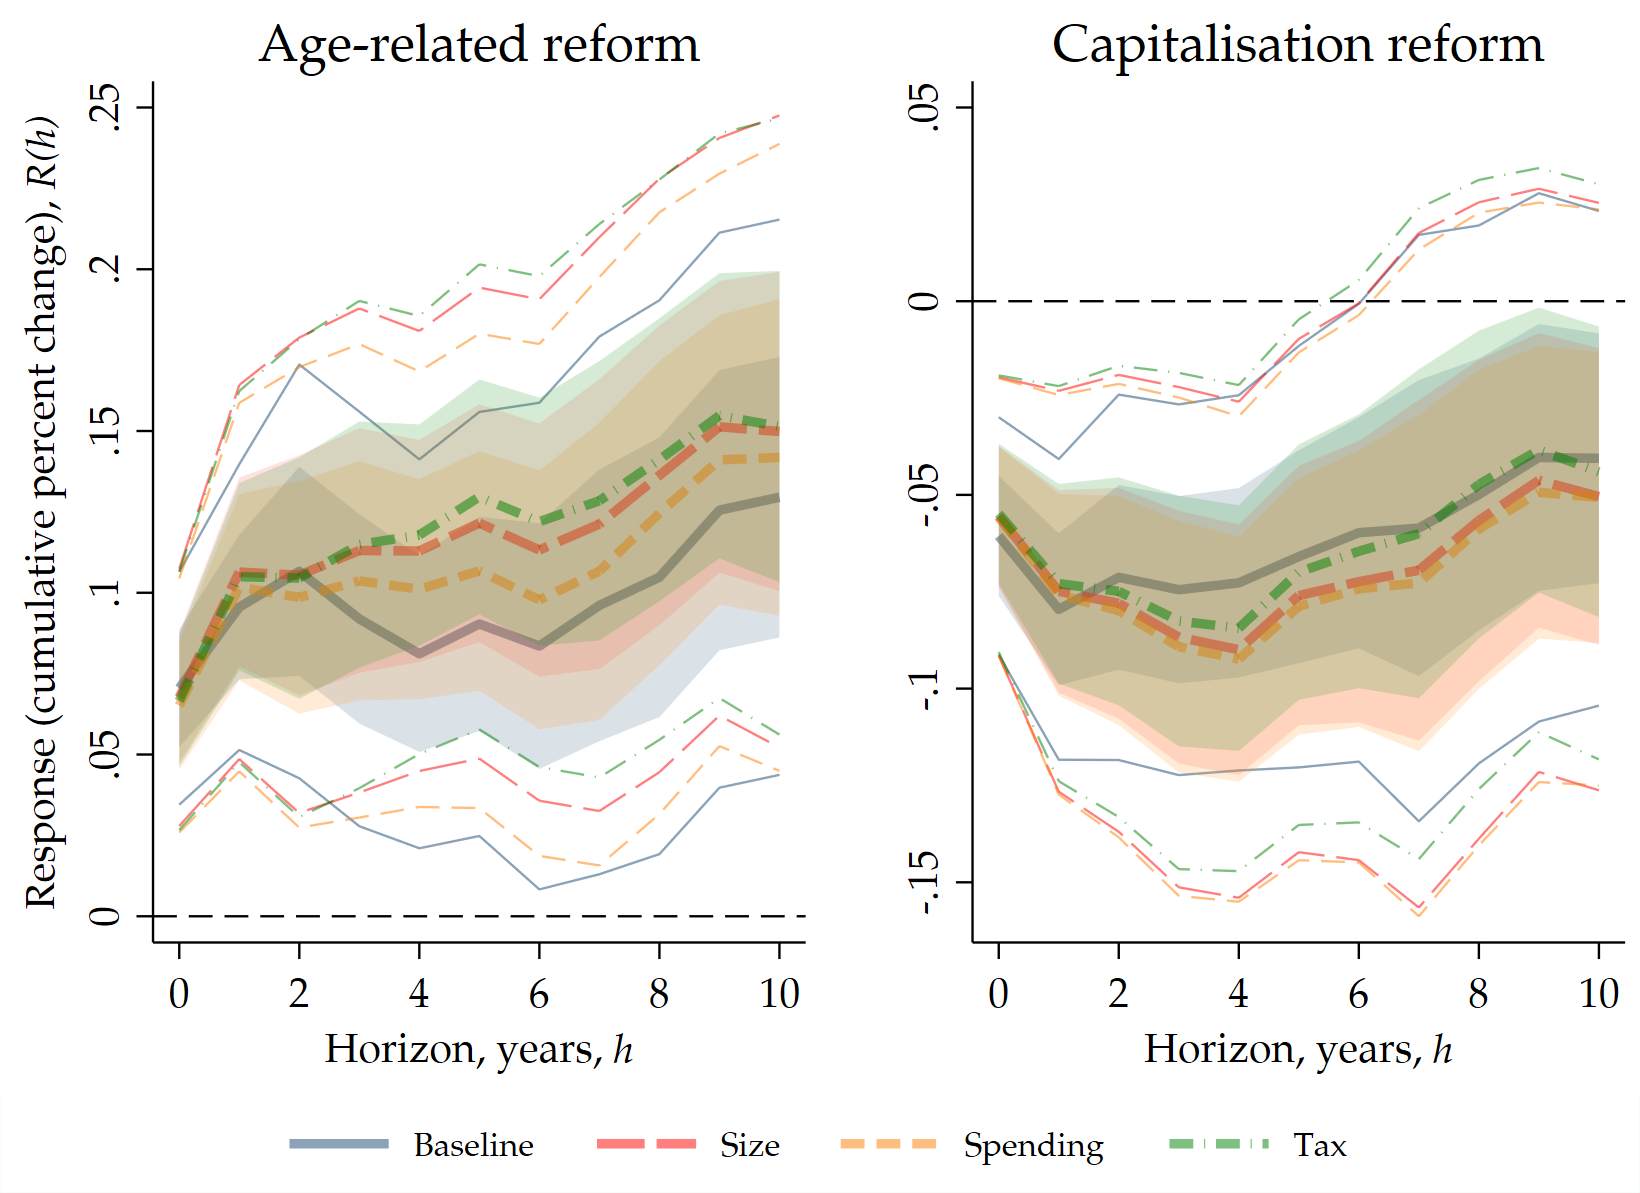
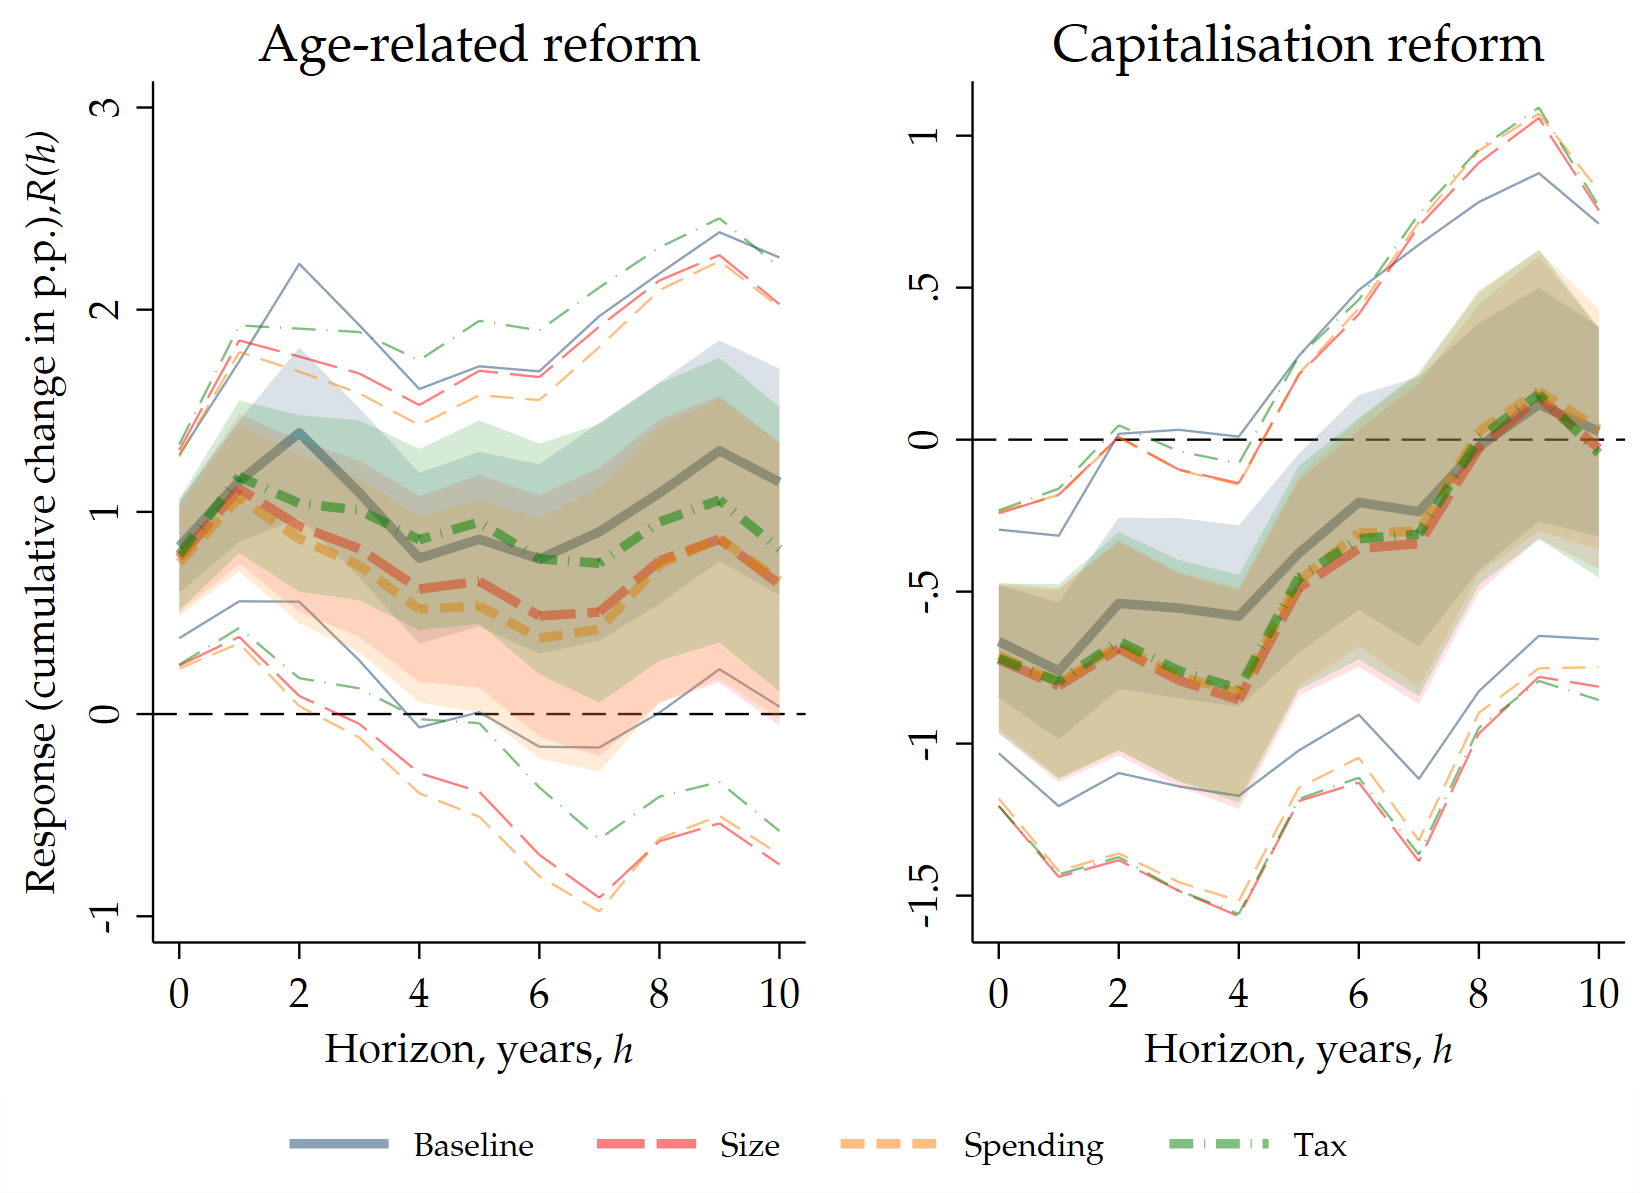
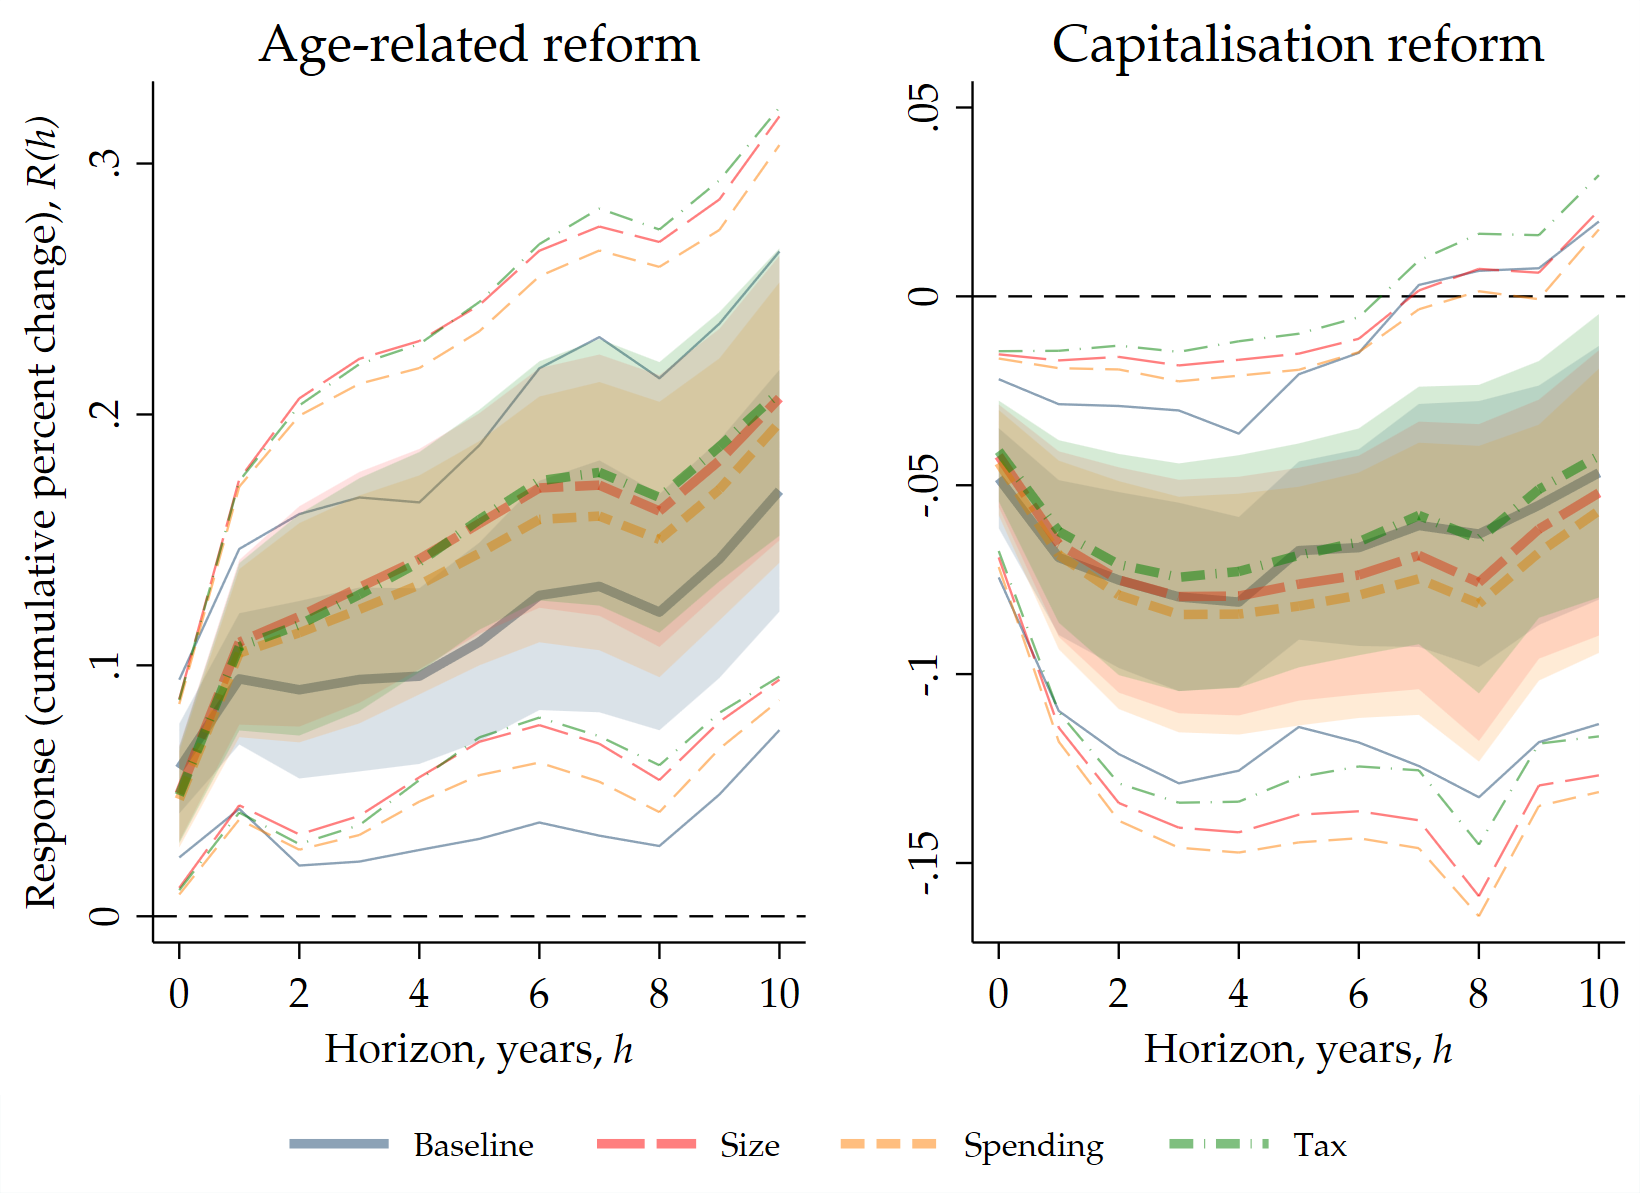
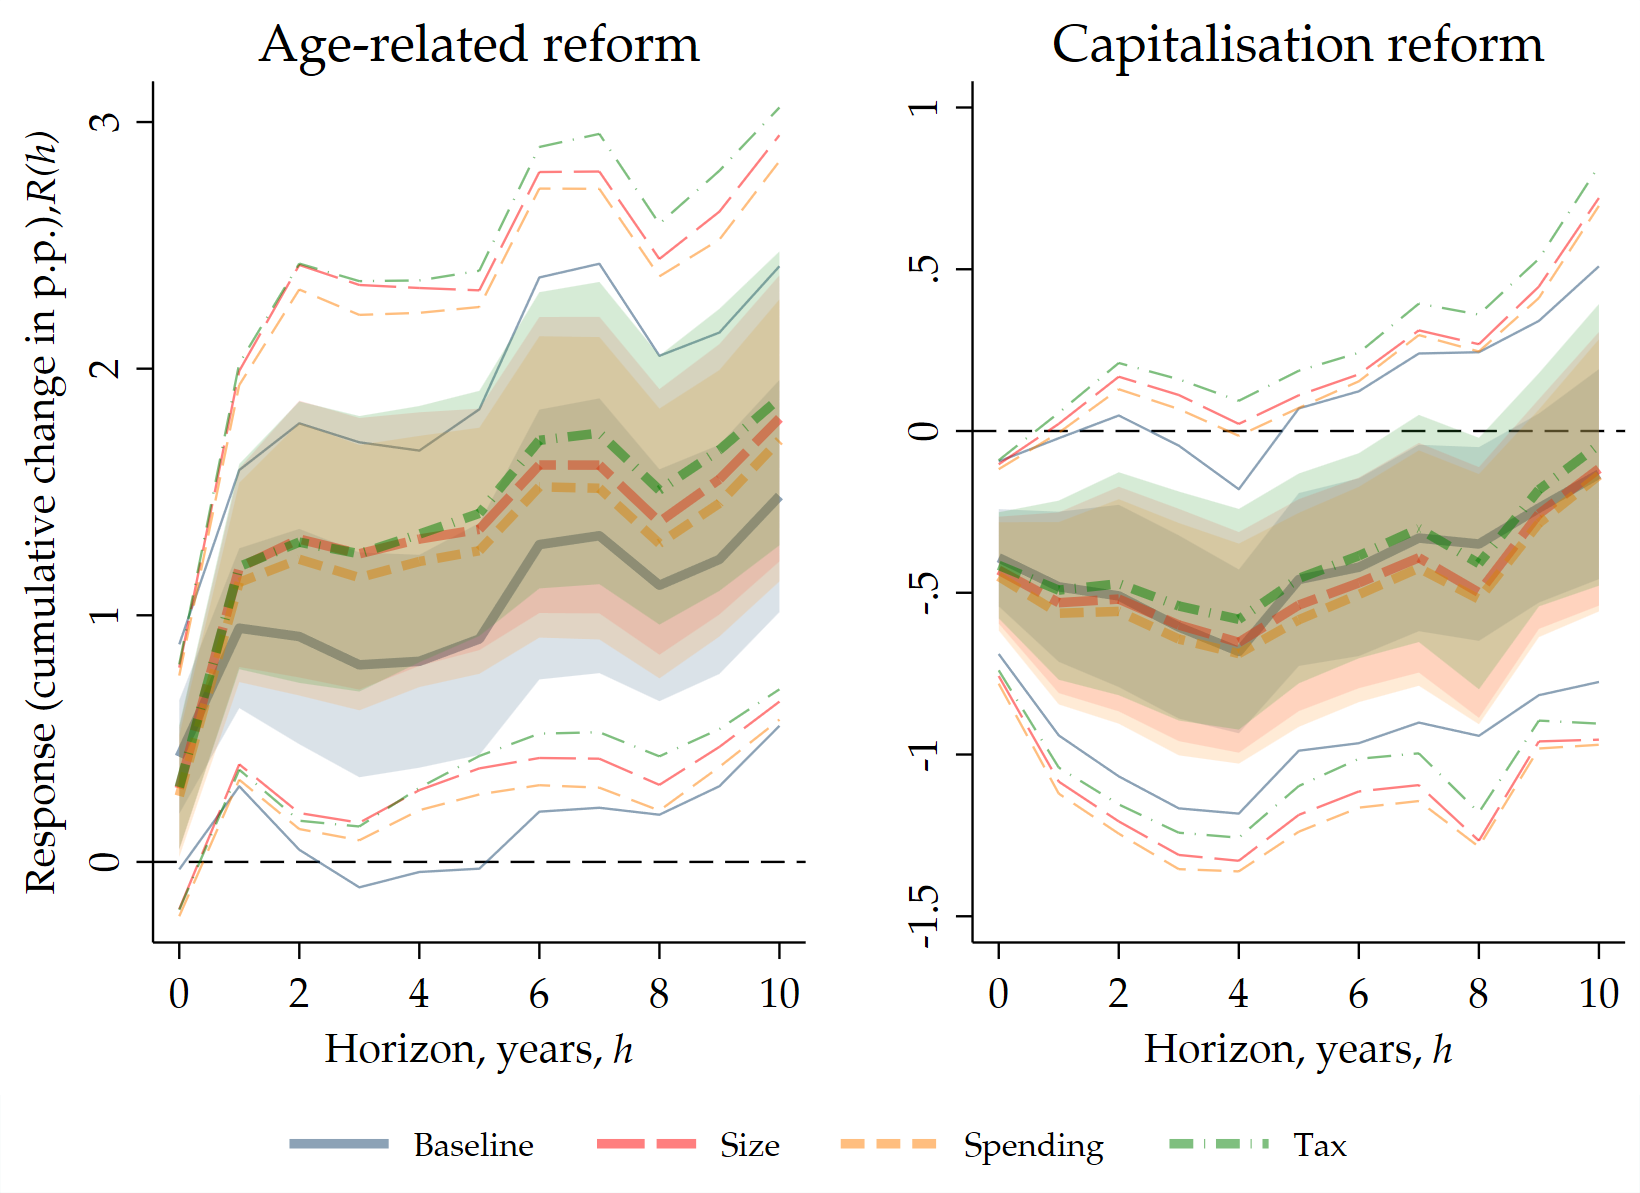
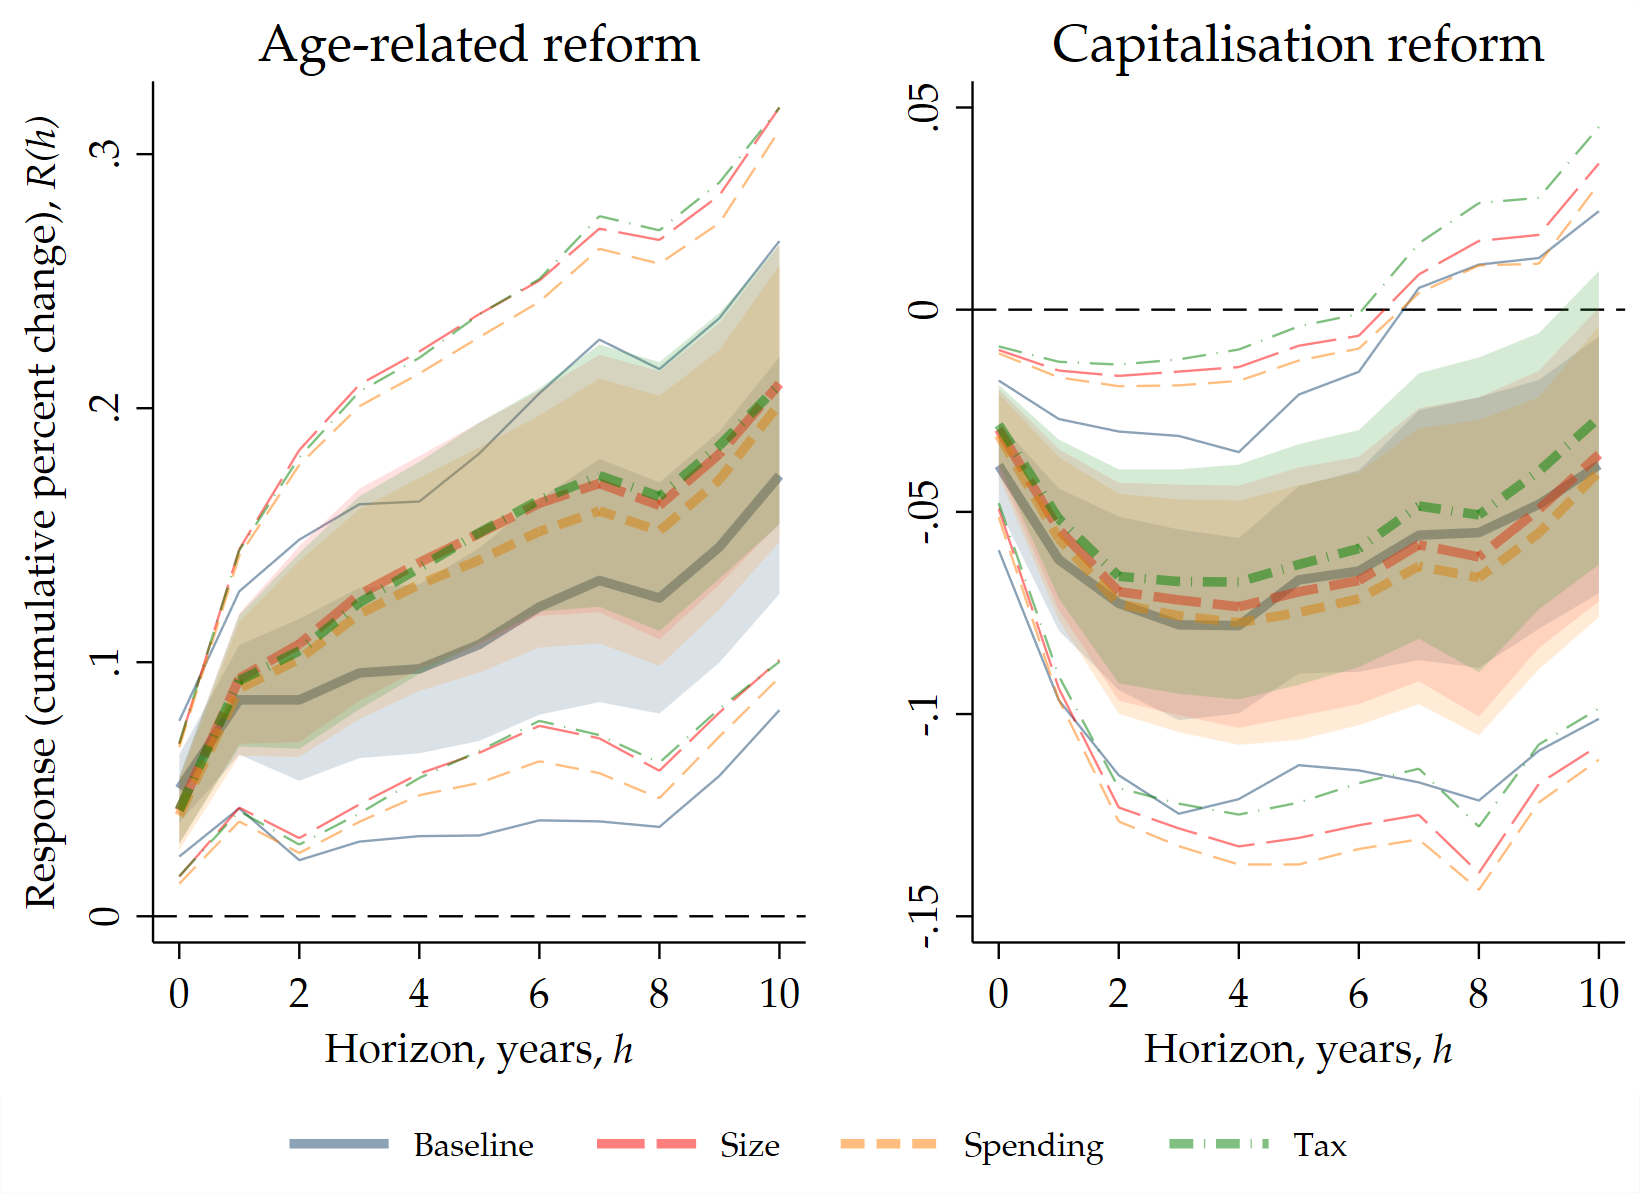
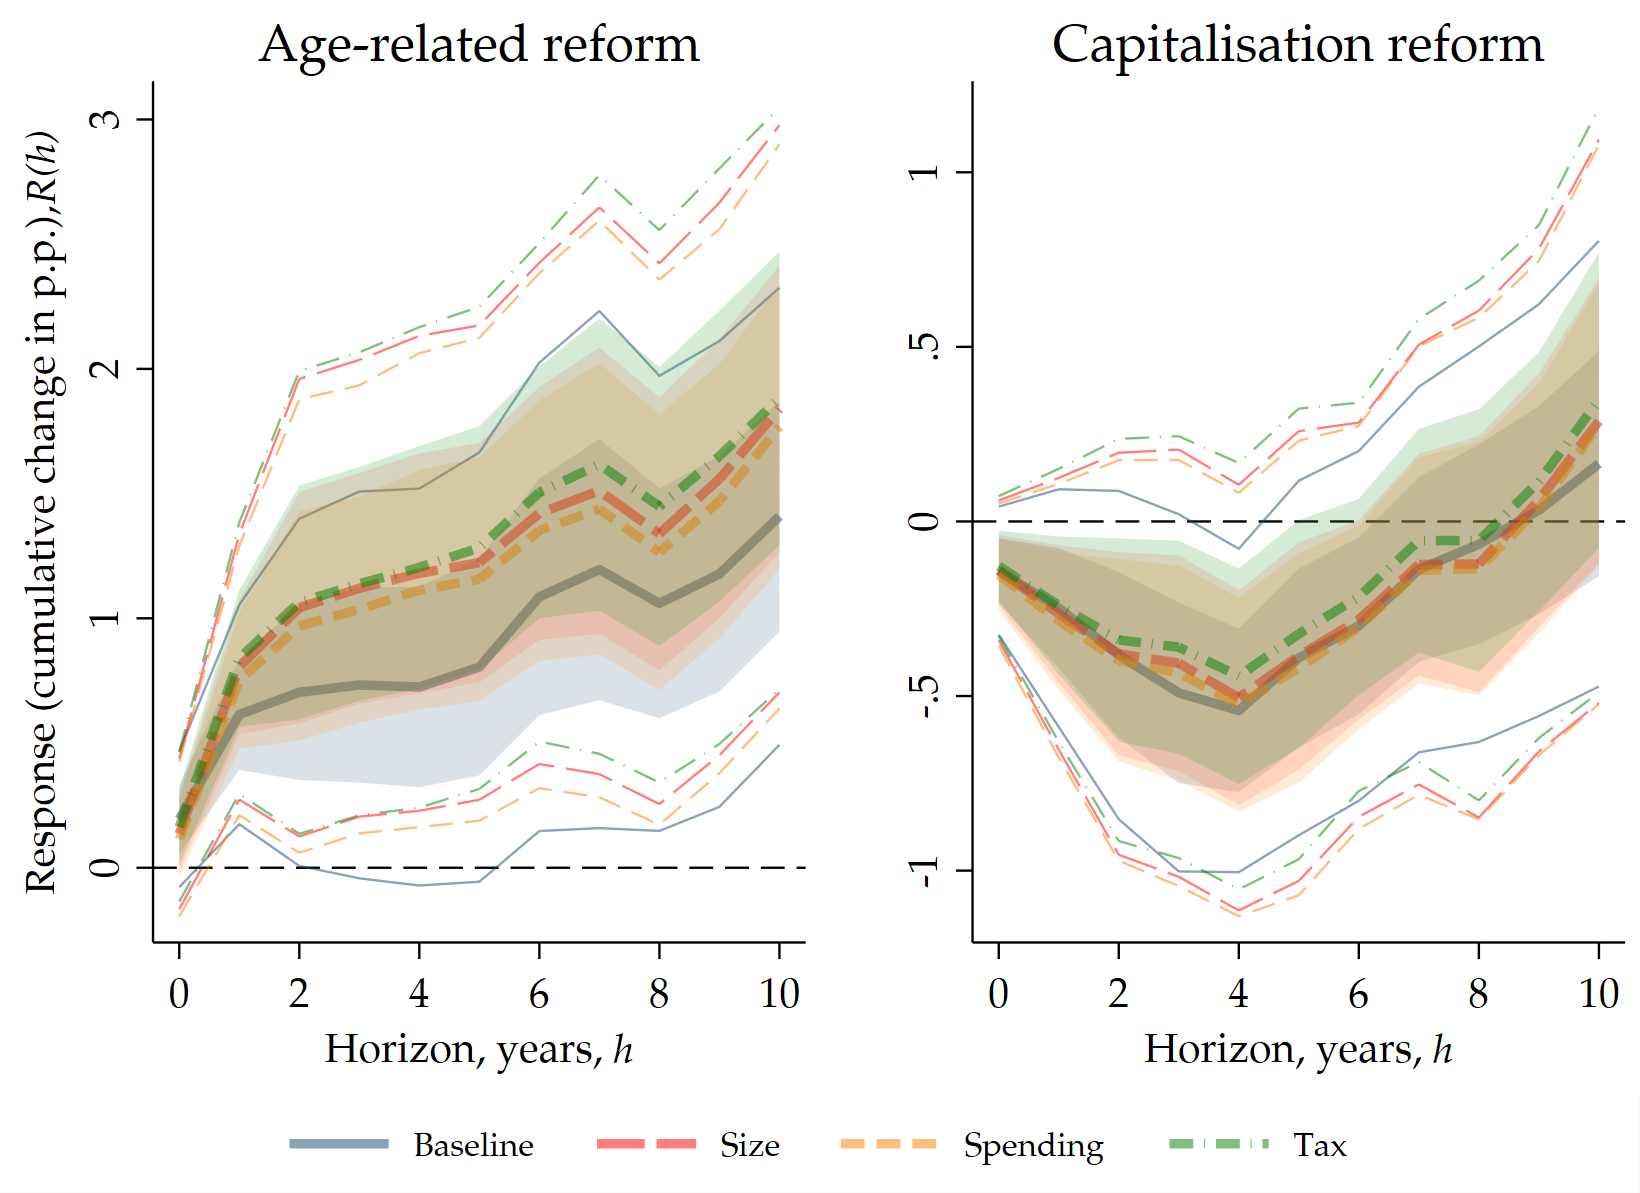
Notes: The figures report our baseline estimates alongside specifications that additionally control for fiscal consolidation. The baseline specification is extended to include, contemporaneously and with up to three lags, alternative measures of fiscal consolidation: the overall size of the consolidation (Size), spending cuts (Spending), and tax increases (Tax). LFPR denotes labour force participation rate. Inferences based on bootstrapped standard errors (1000 replications). Shaded areas (thin lines) denote the 68% (95%) pointwise confidence intervals.
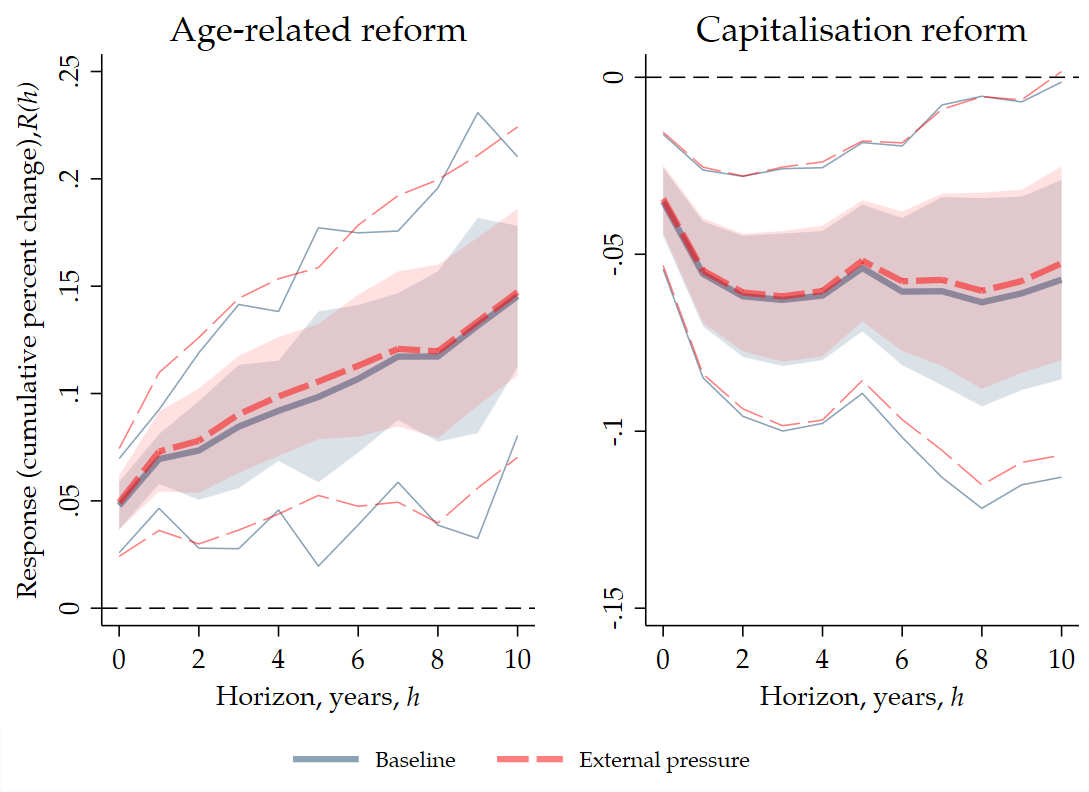
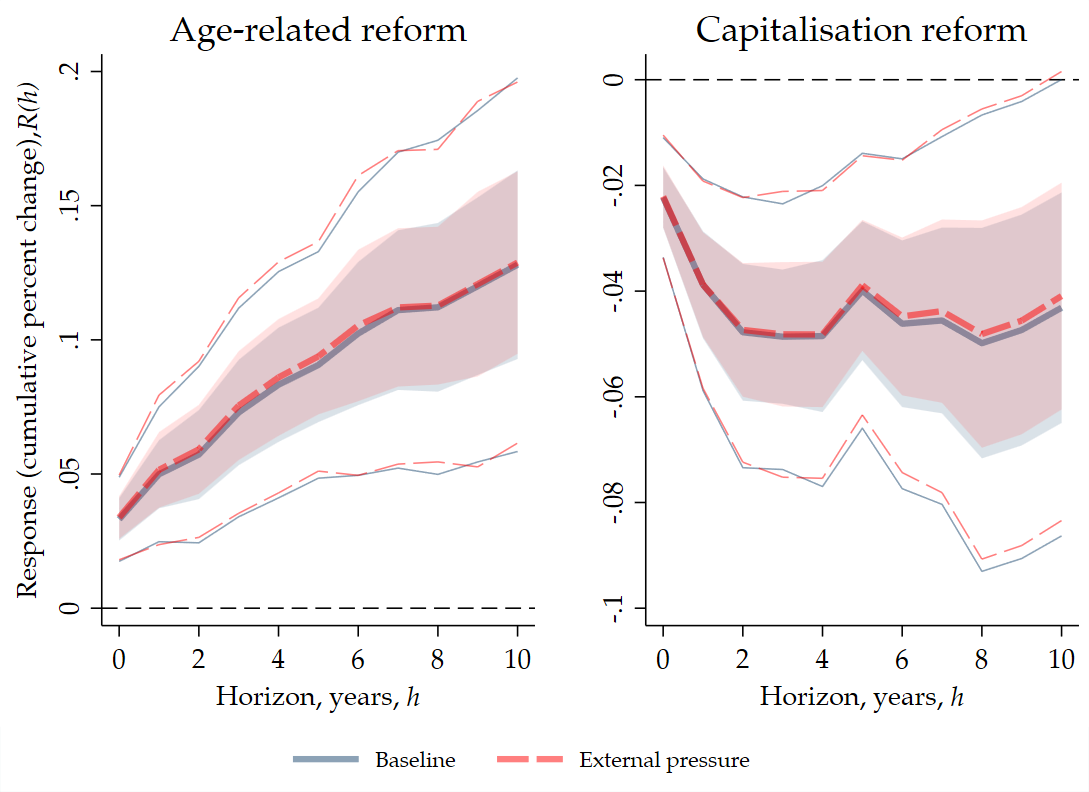
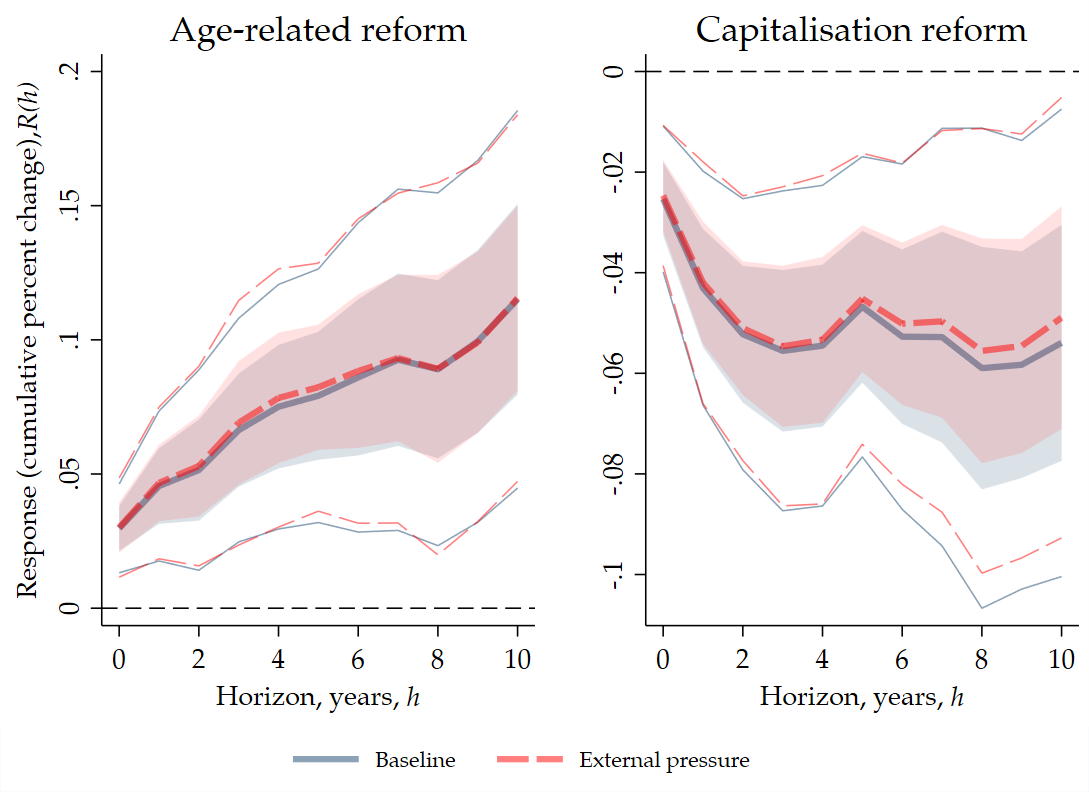
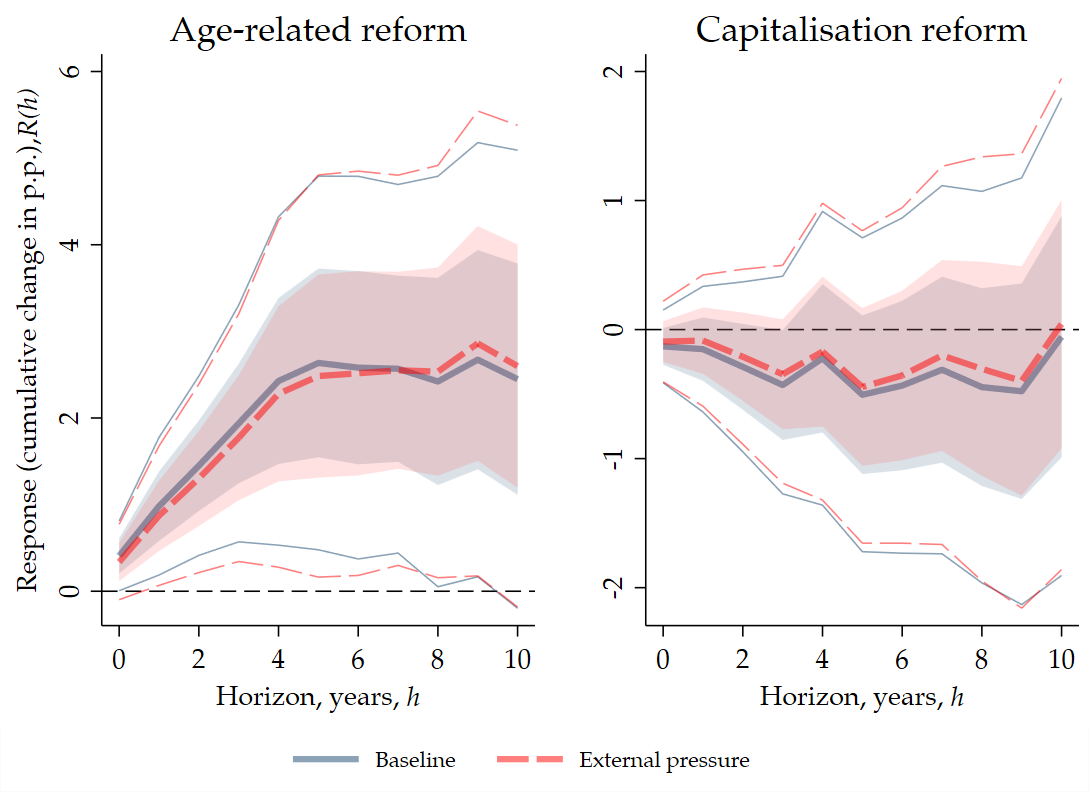
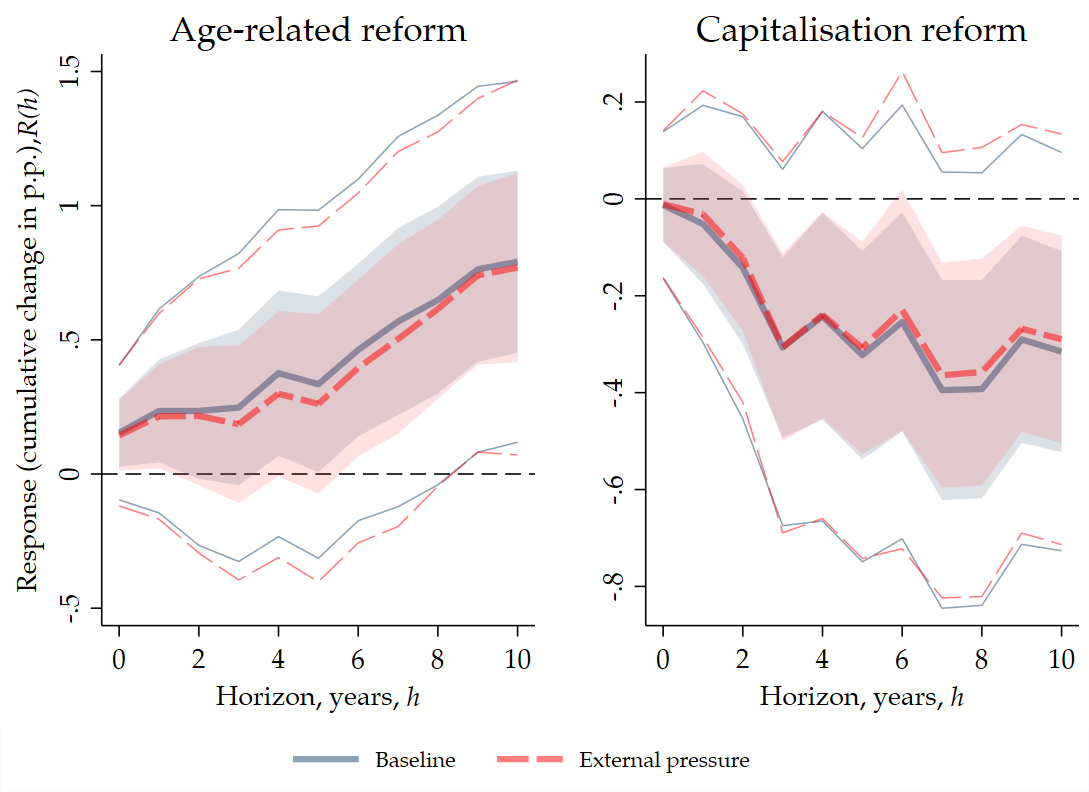
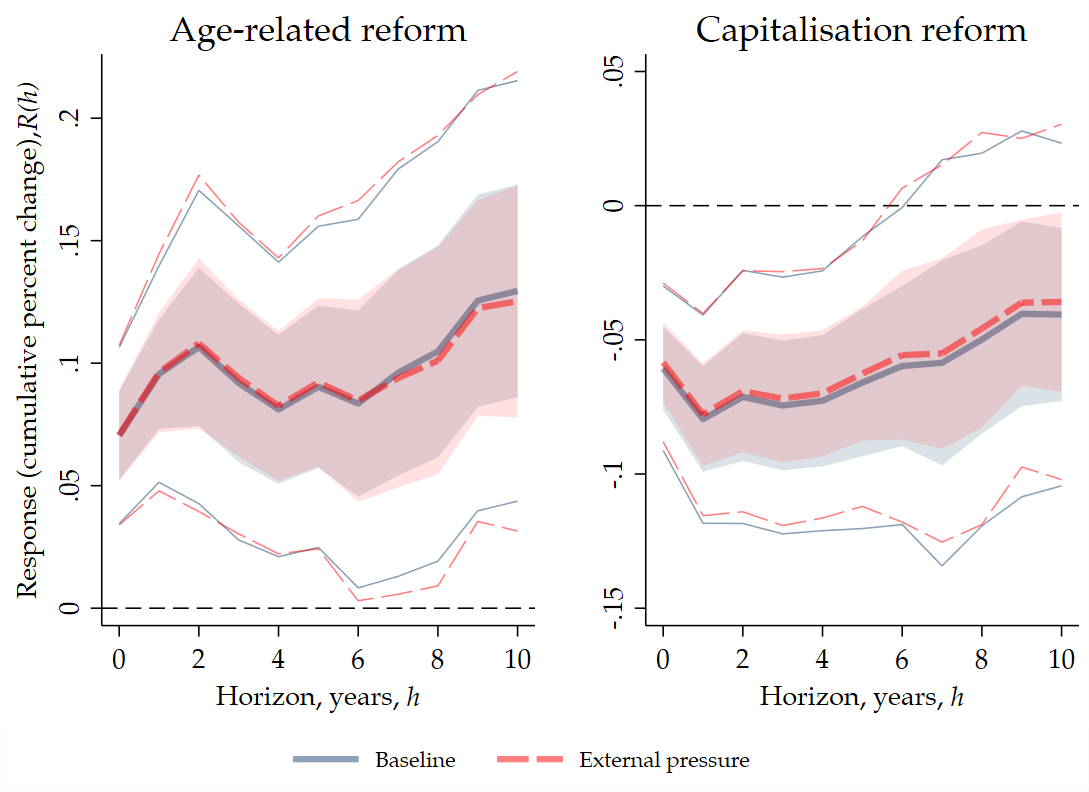
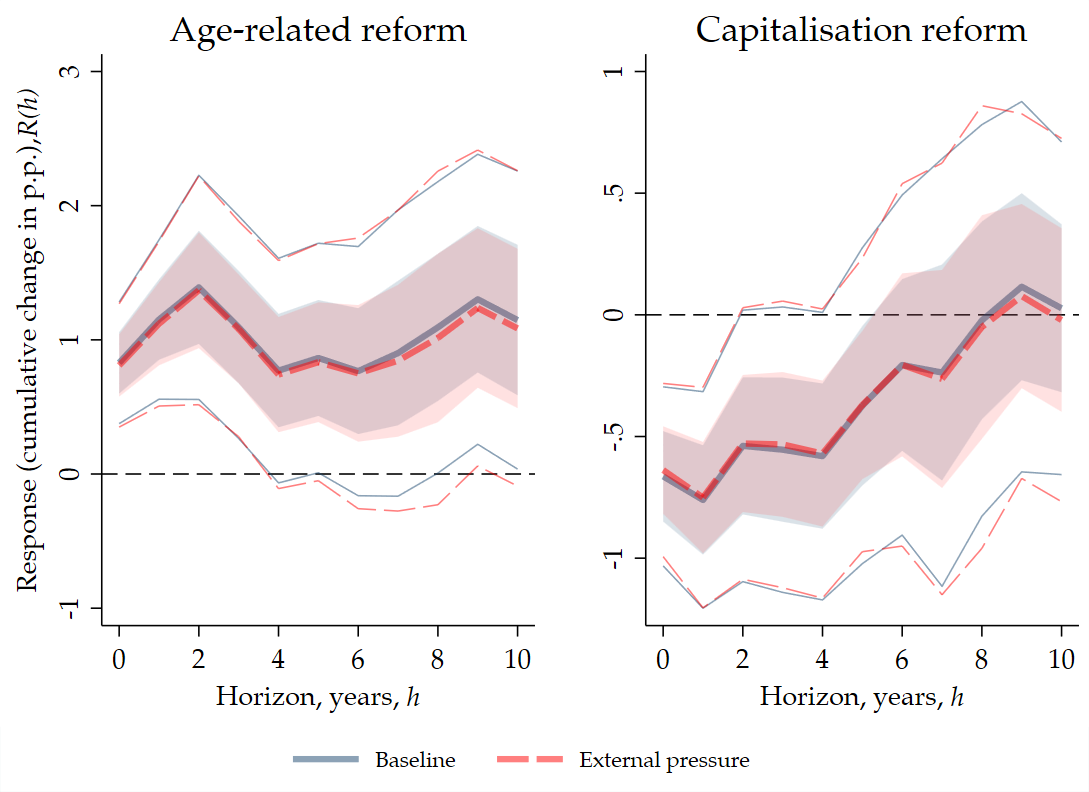
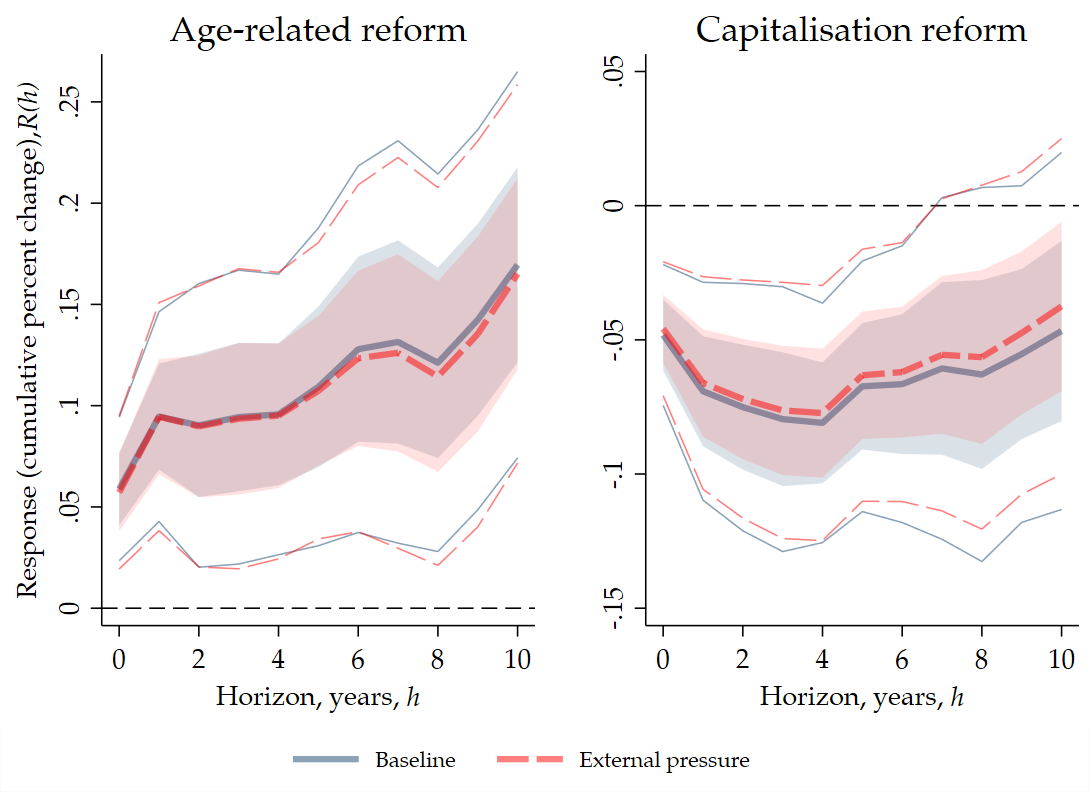
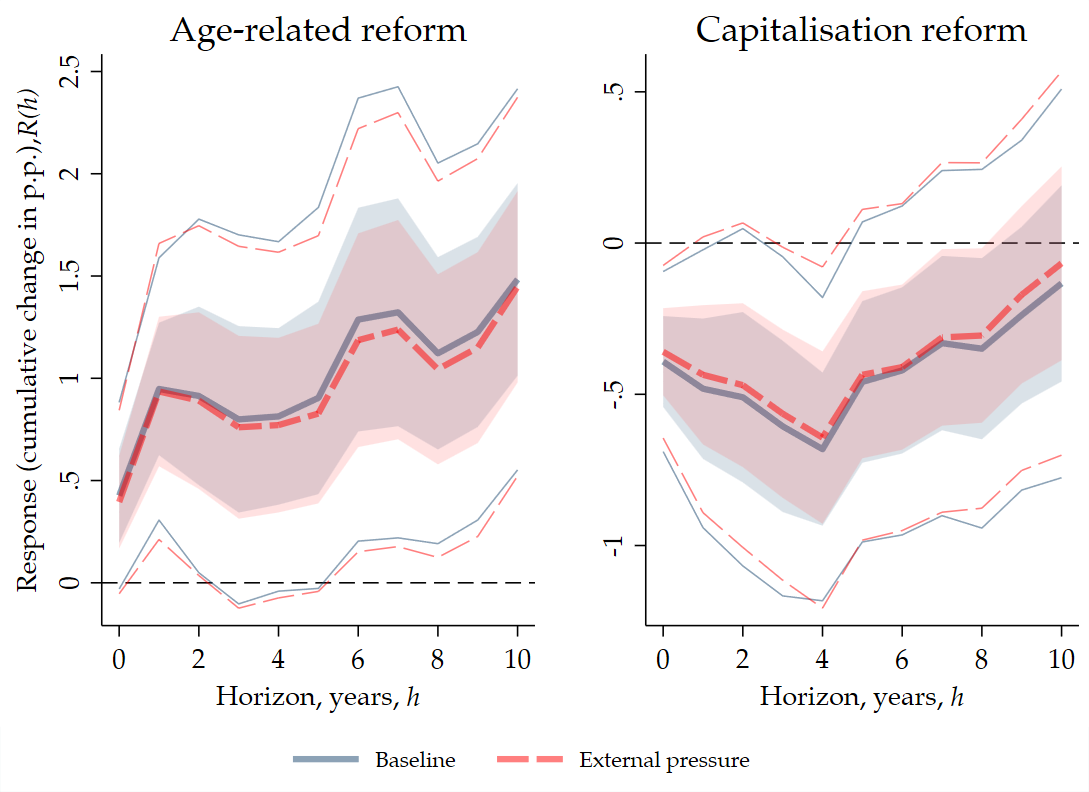
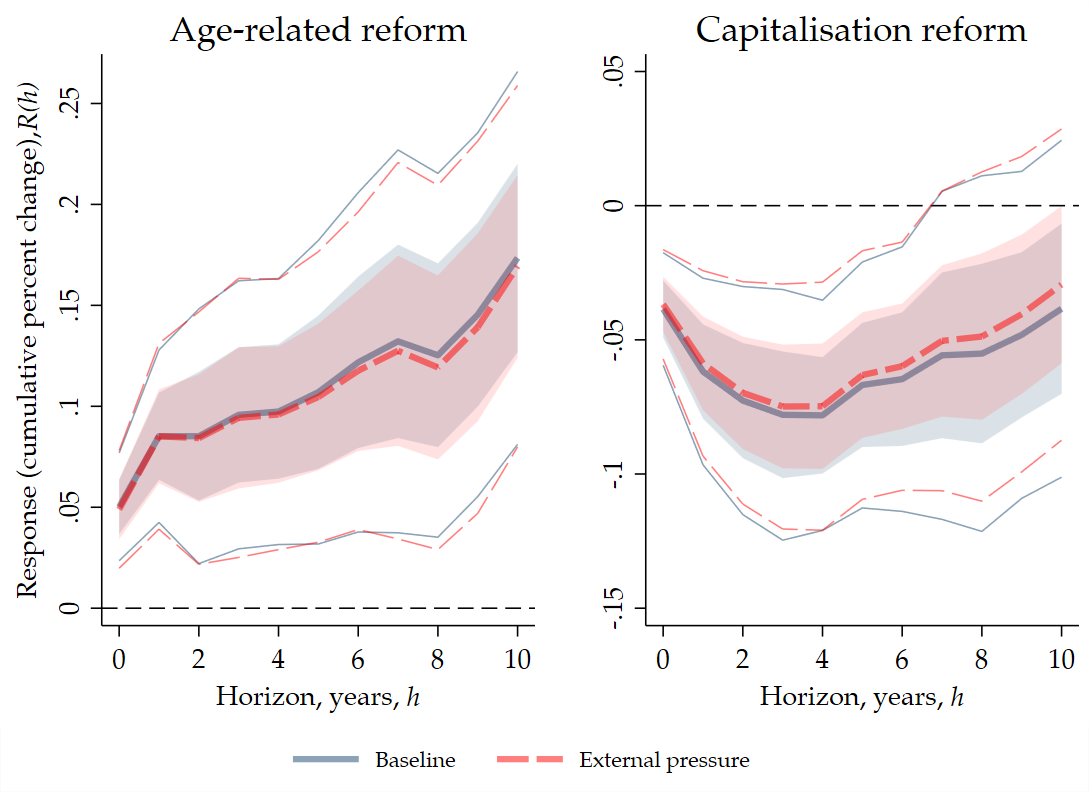
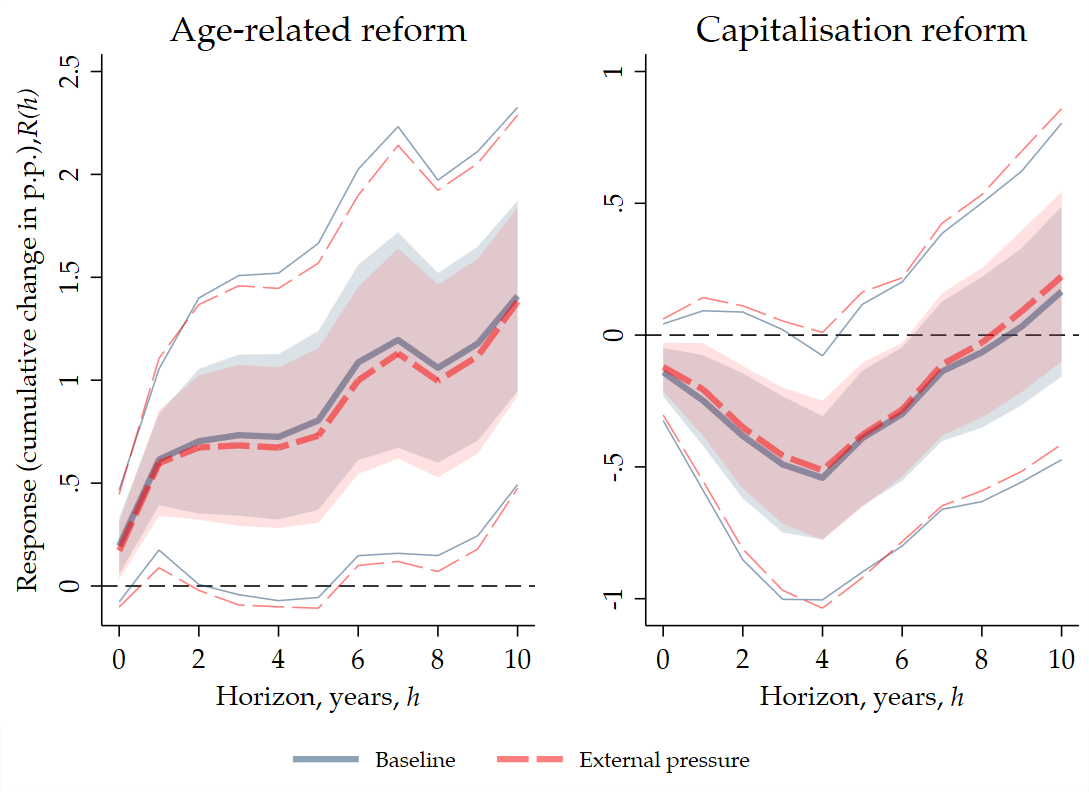
Notes: The figures report our baseline estimates alongside specifications that additionally control for spillovers and external pressure. The baseline specification is extended to include, contemporaneously and with up to three lags, the leave-one-out means of our age and funded-pension reform measures, as well as the leave-one-out mean of an indicator variable for reform-voting years. LFPR denotes labour force participation rate. Inferences based on bootstrapped standard errors (1000 replications). Shaded areas (thin lines) denote the 68% (95%) pointwise confidence intervals.
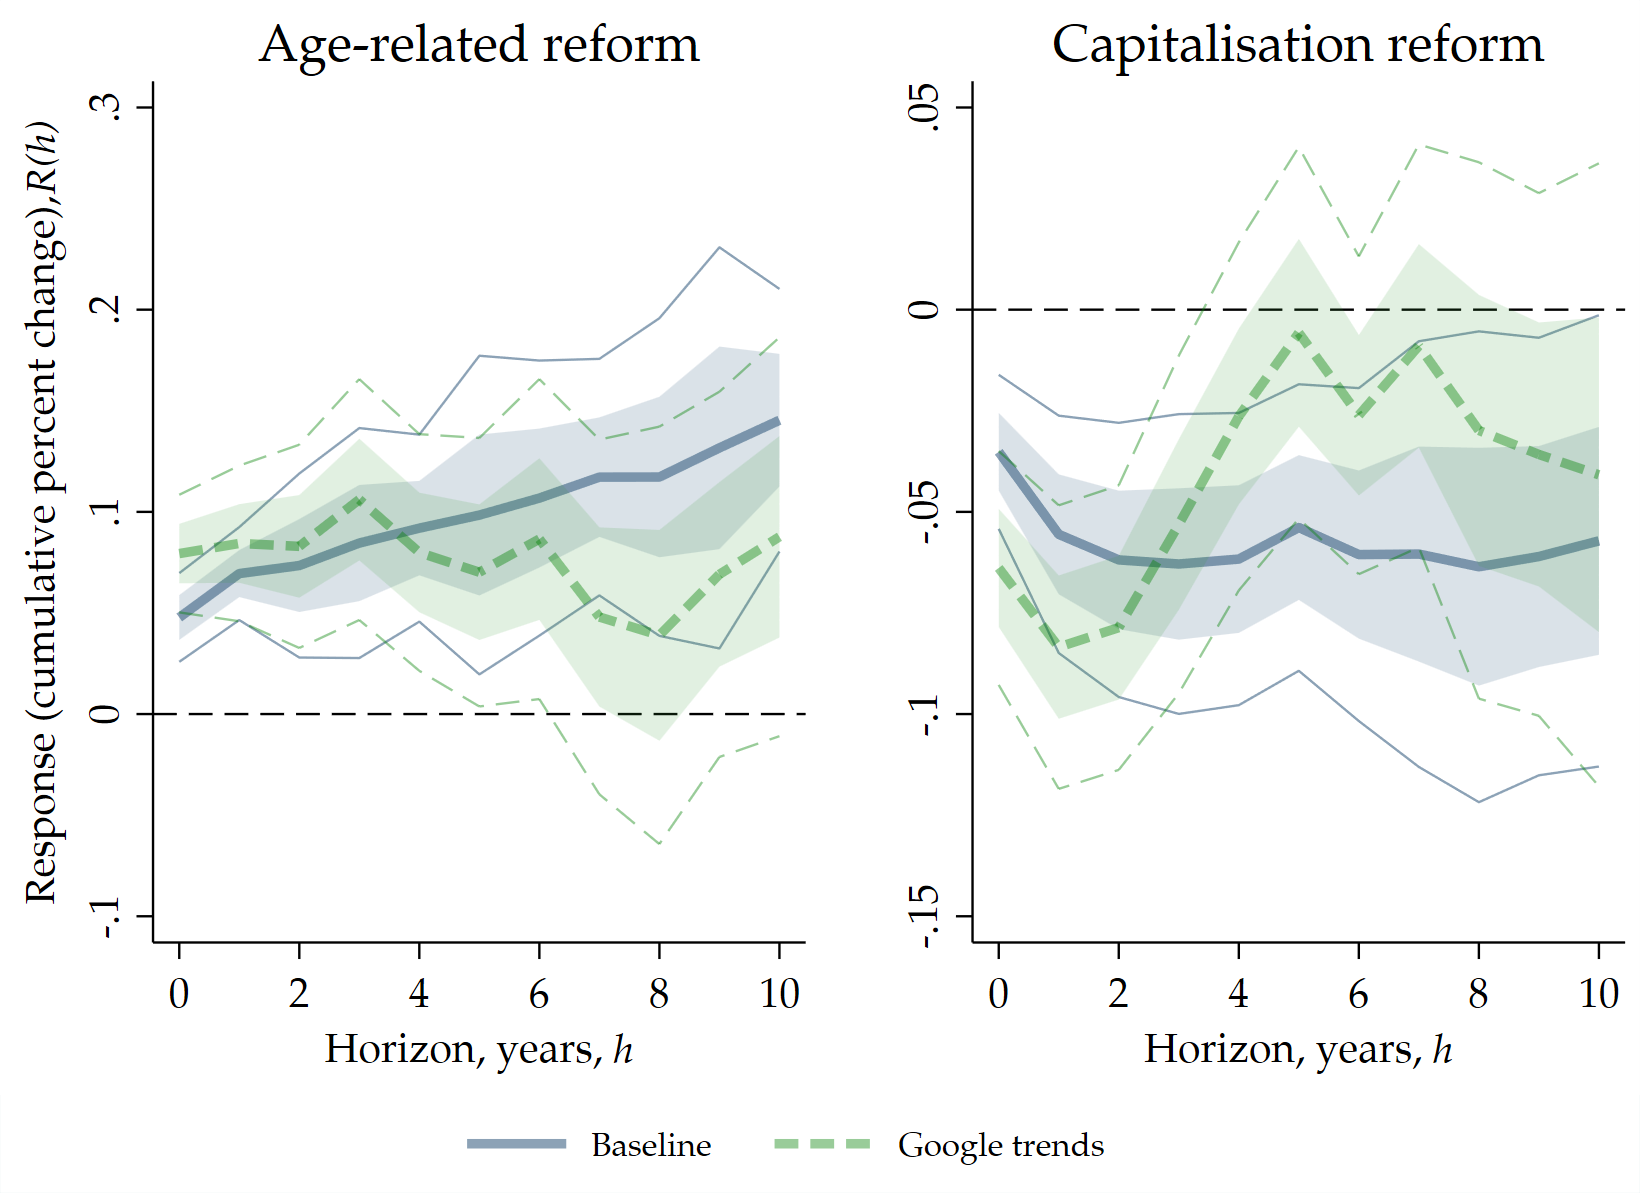
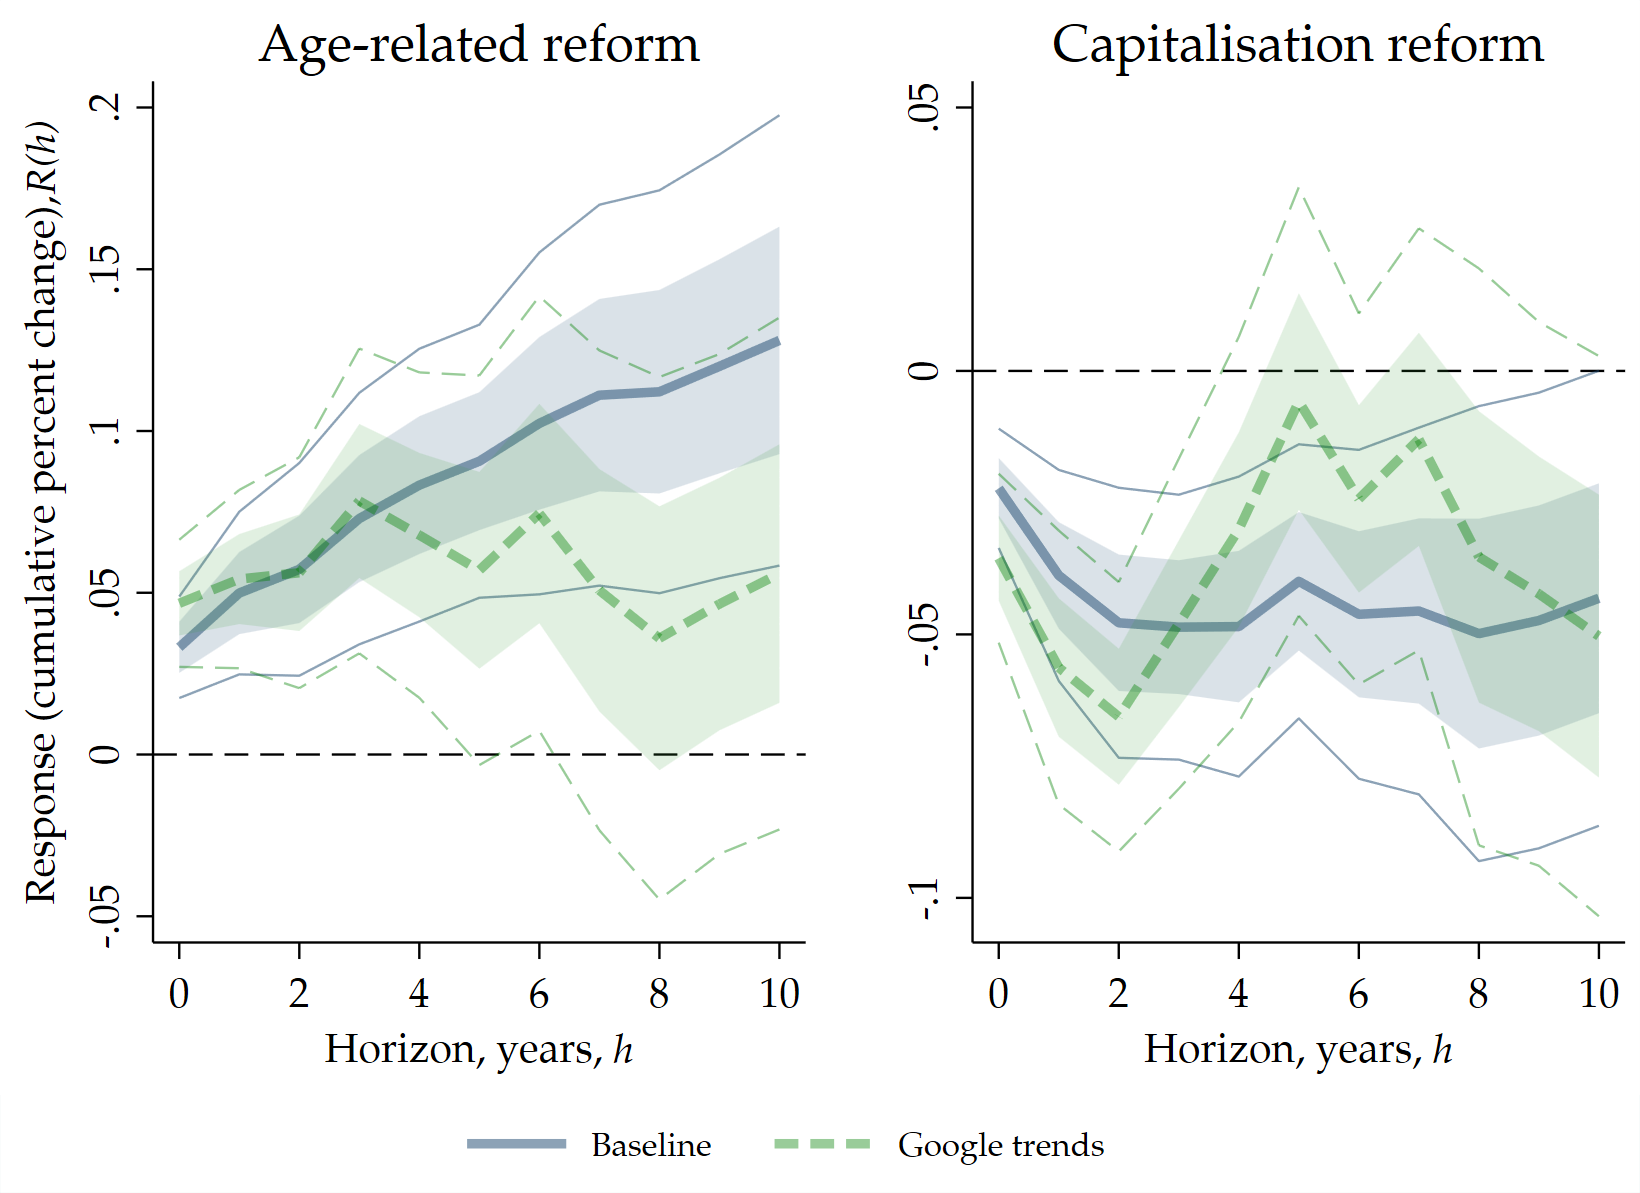
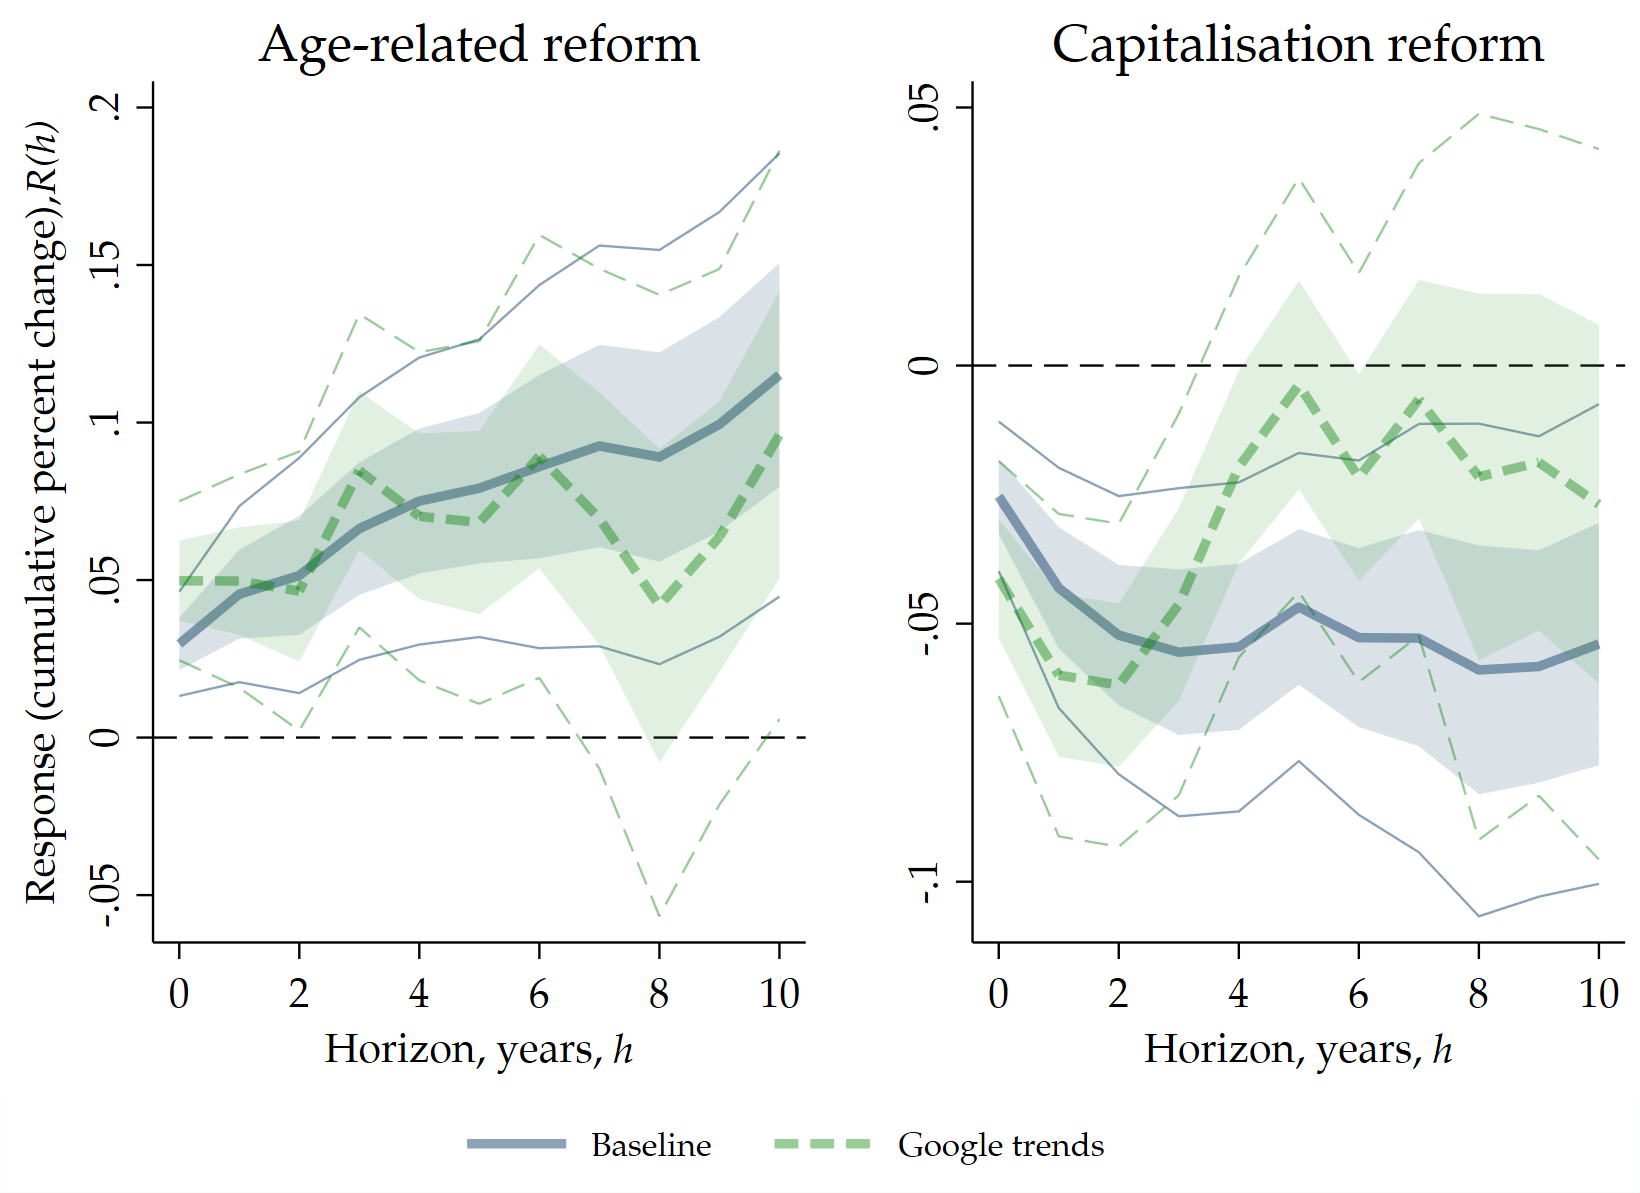
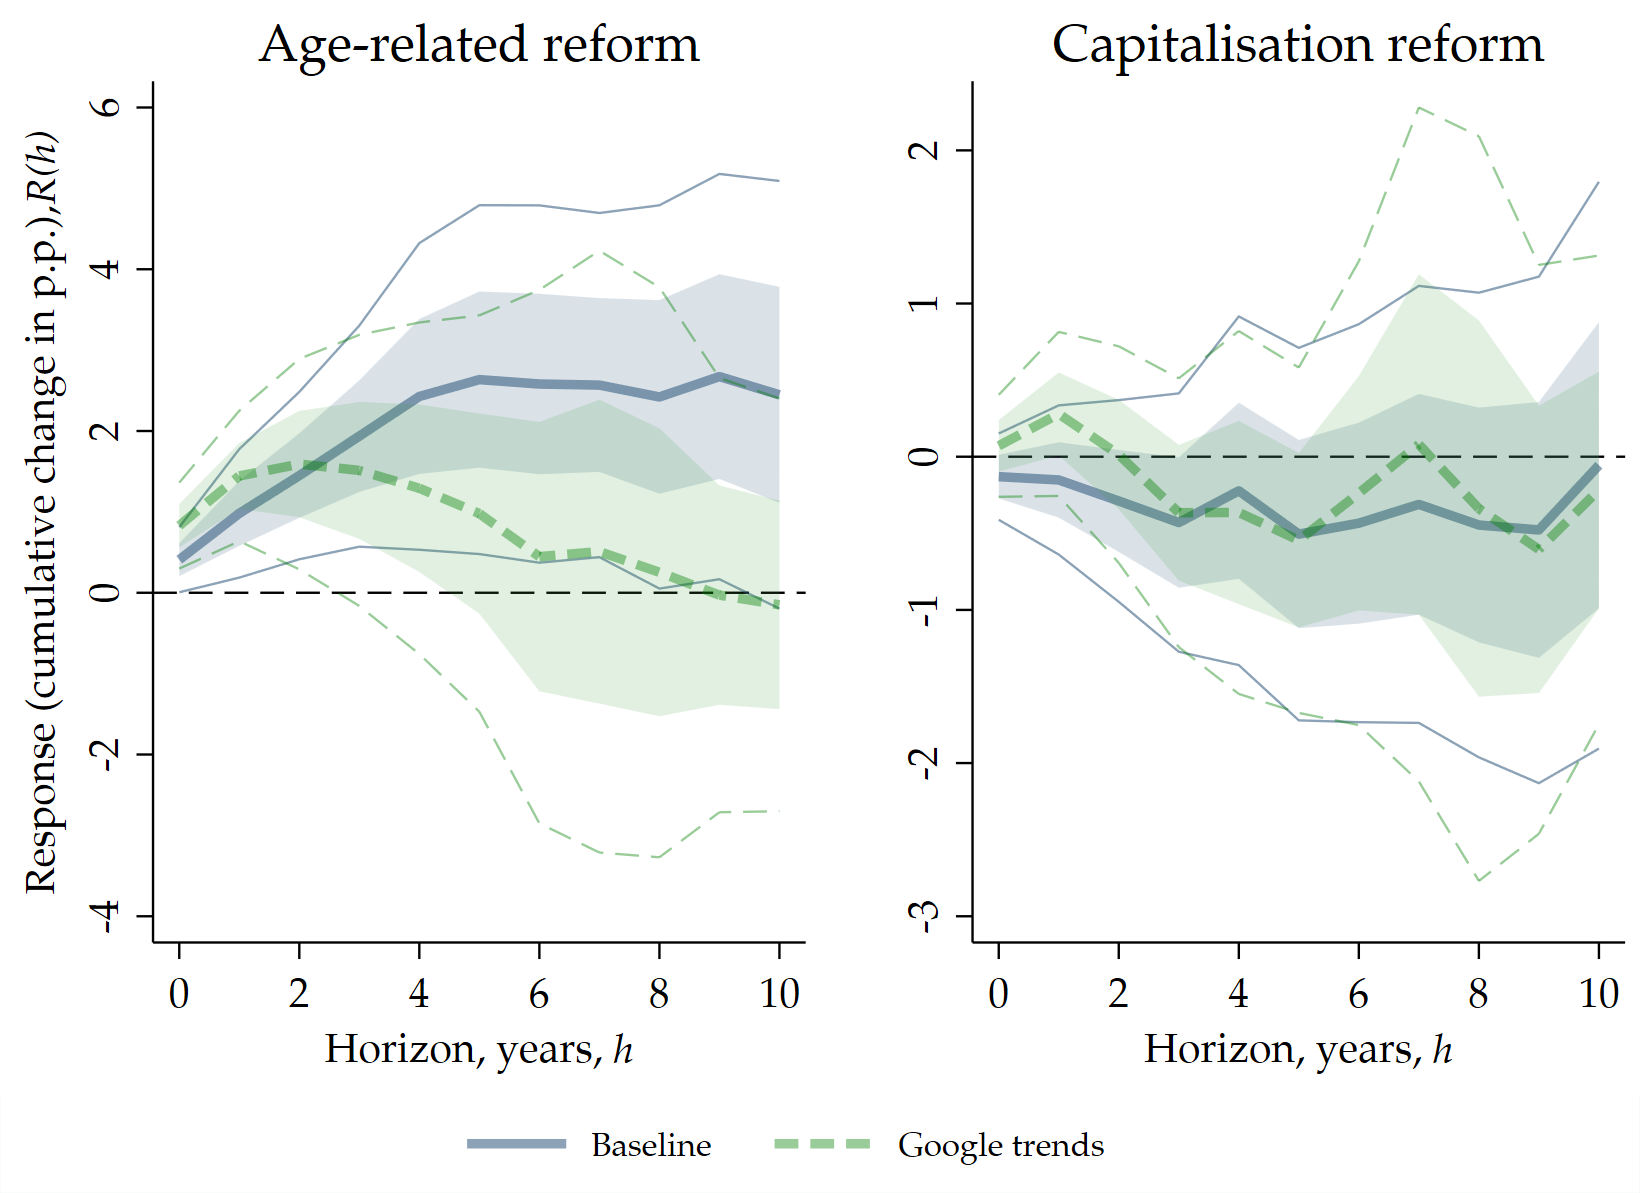
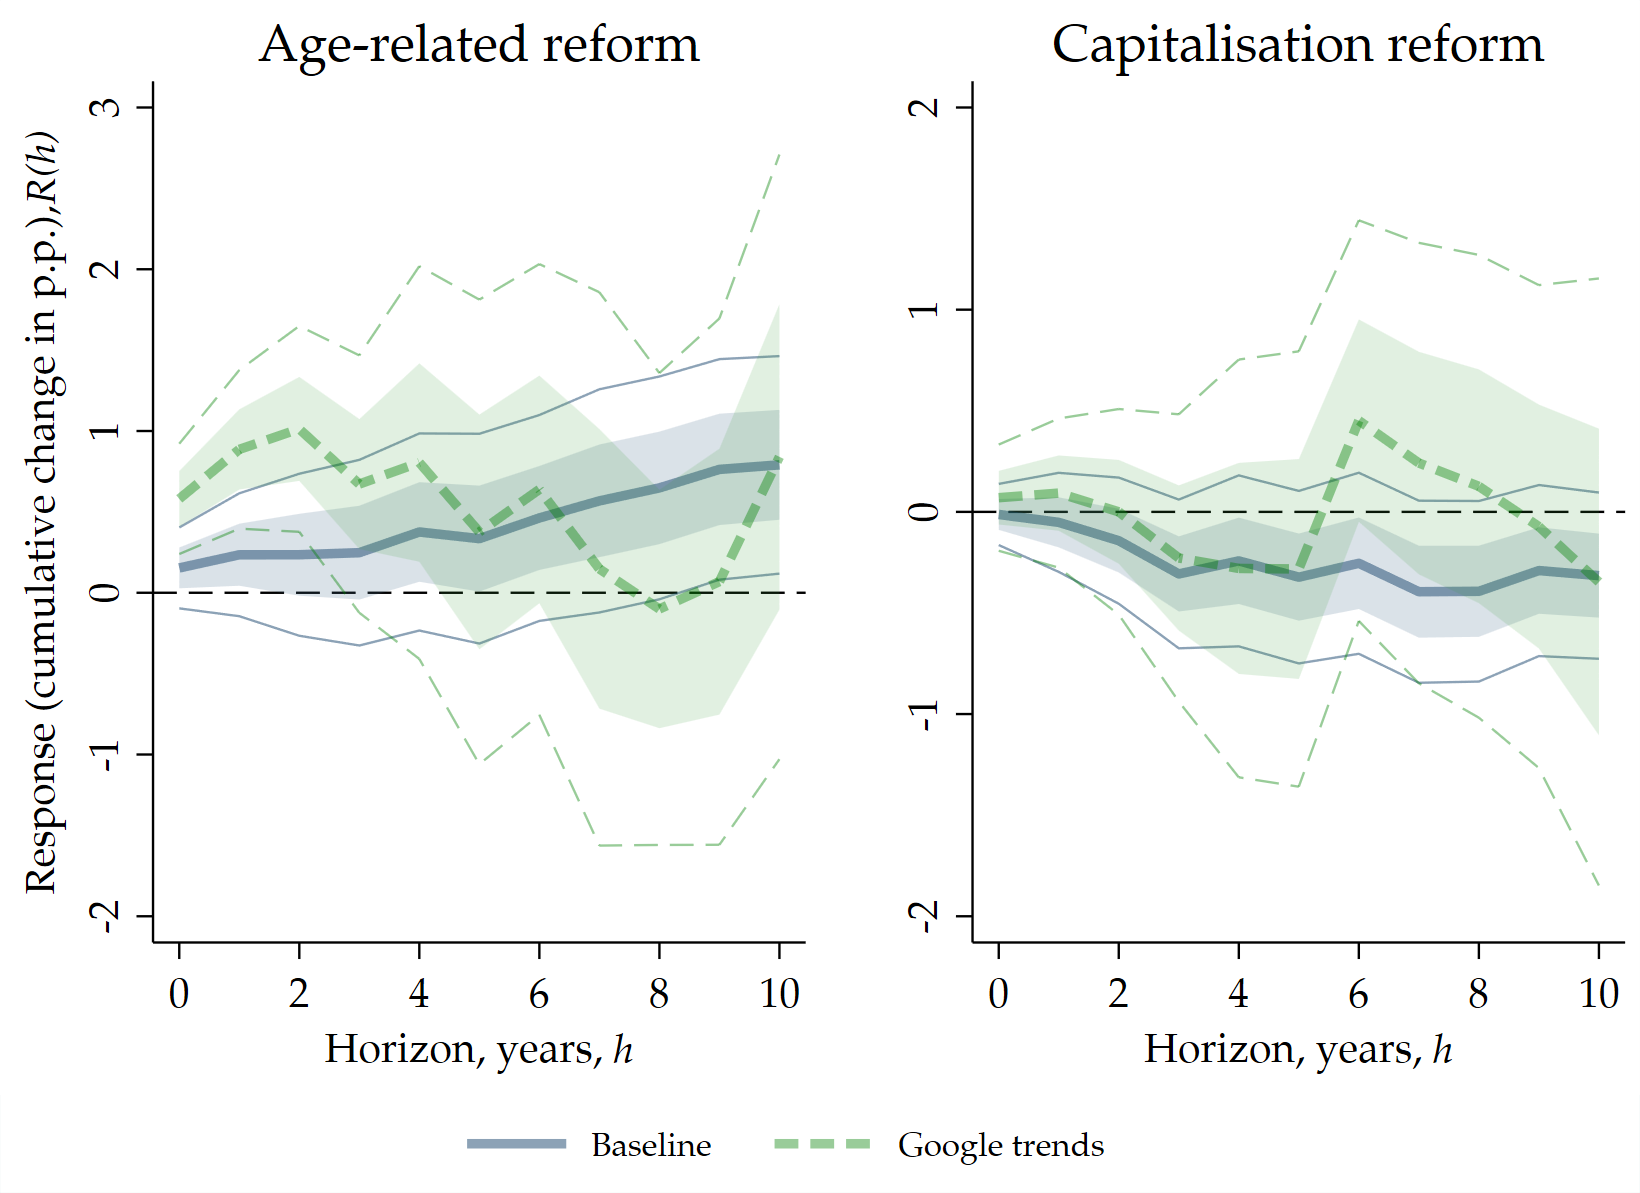
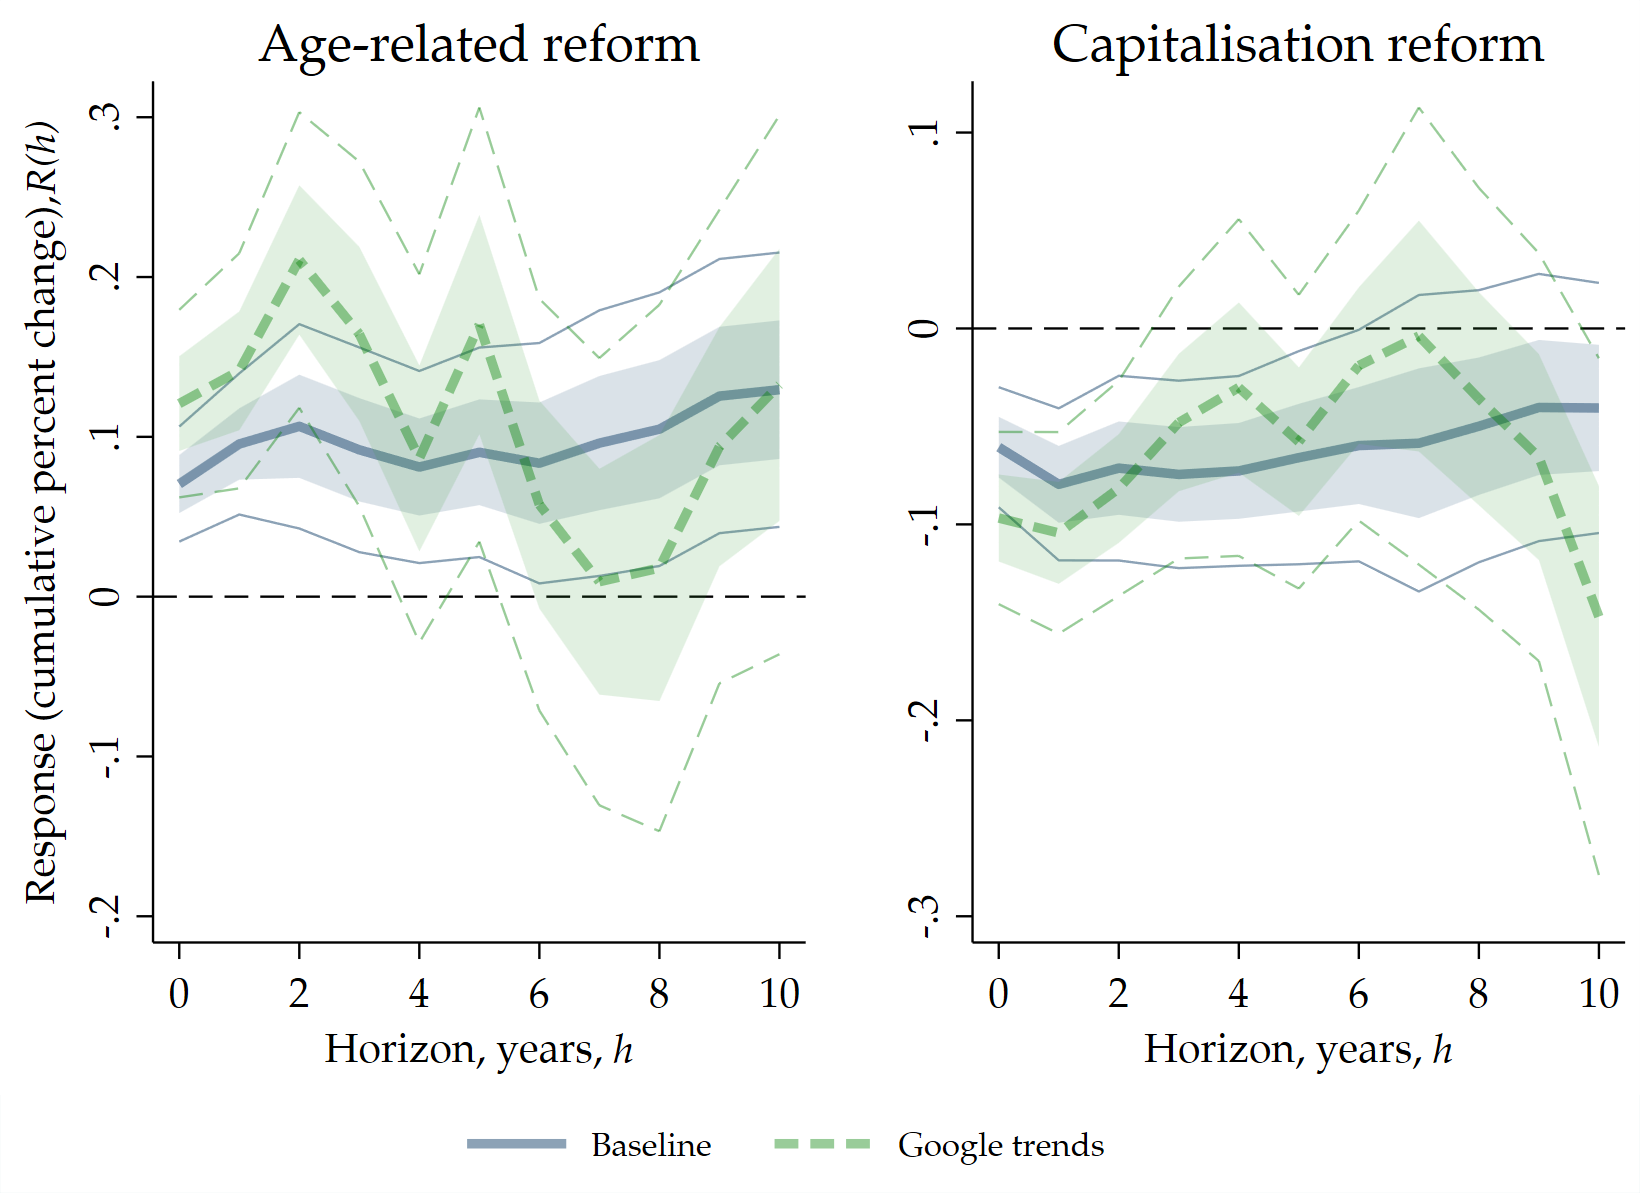
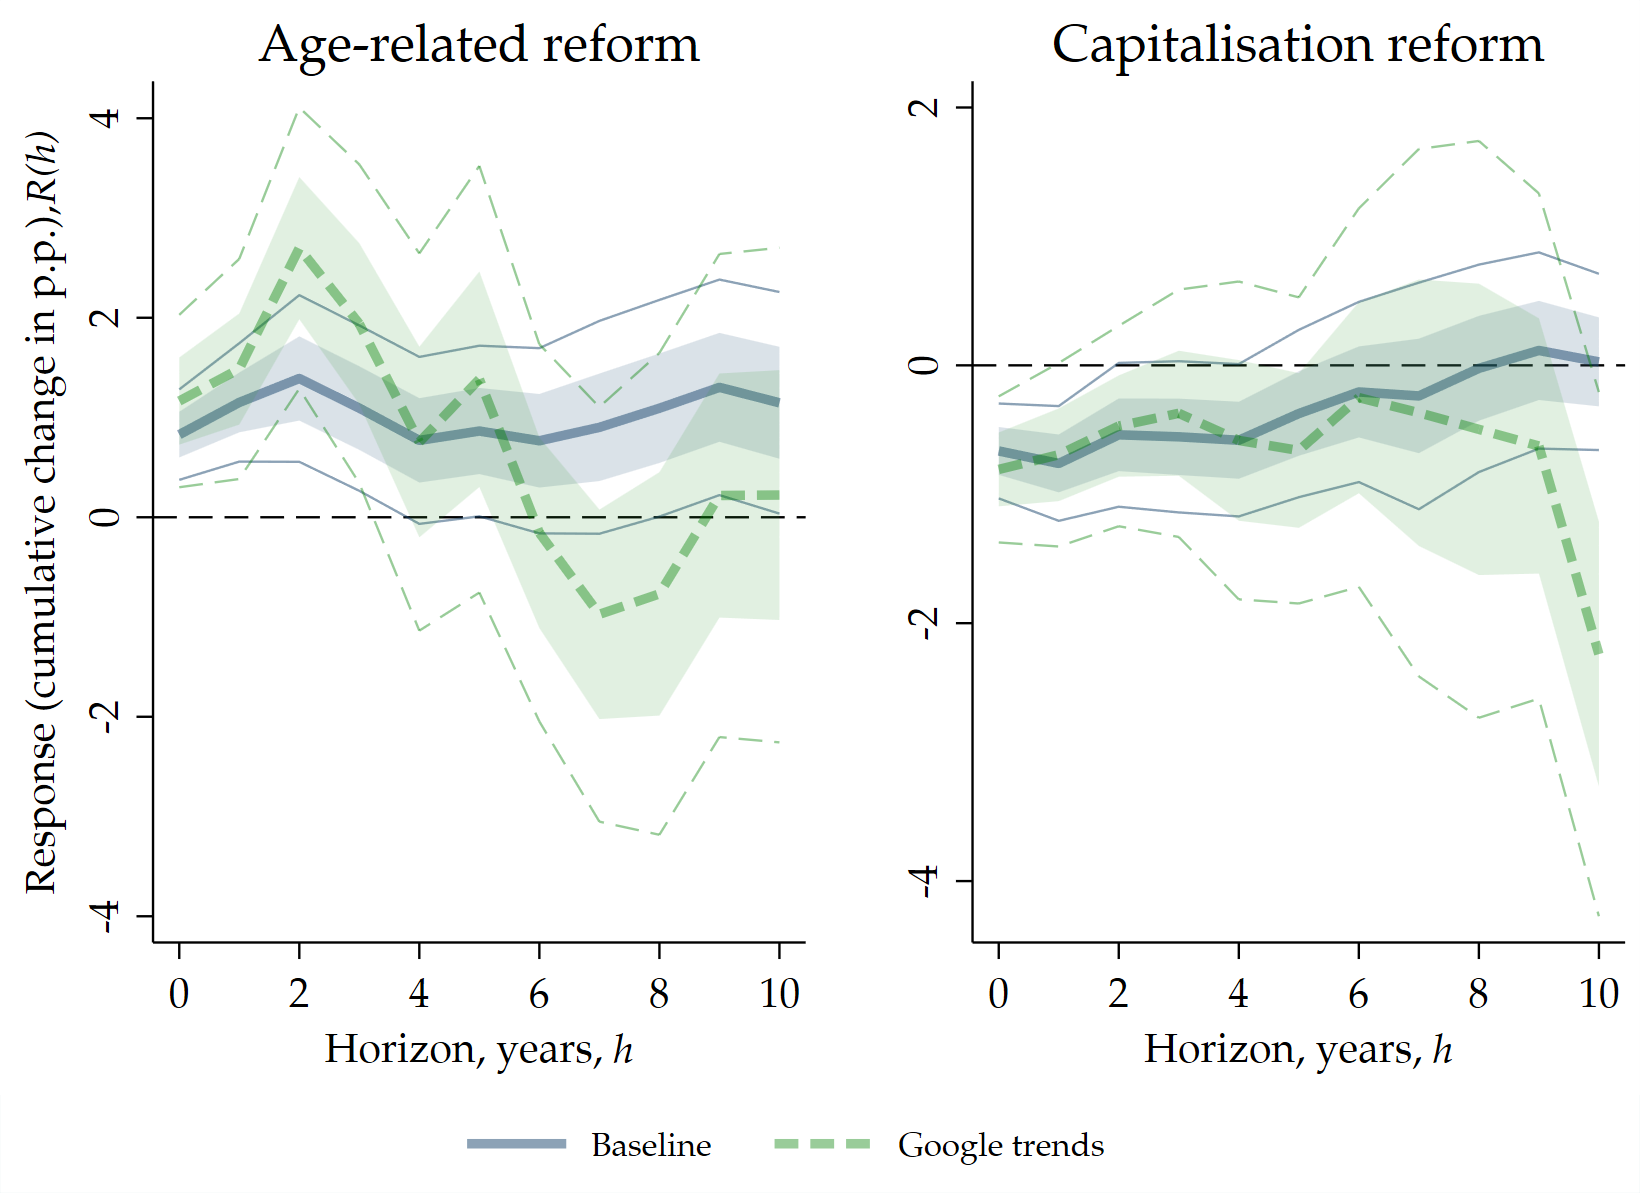
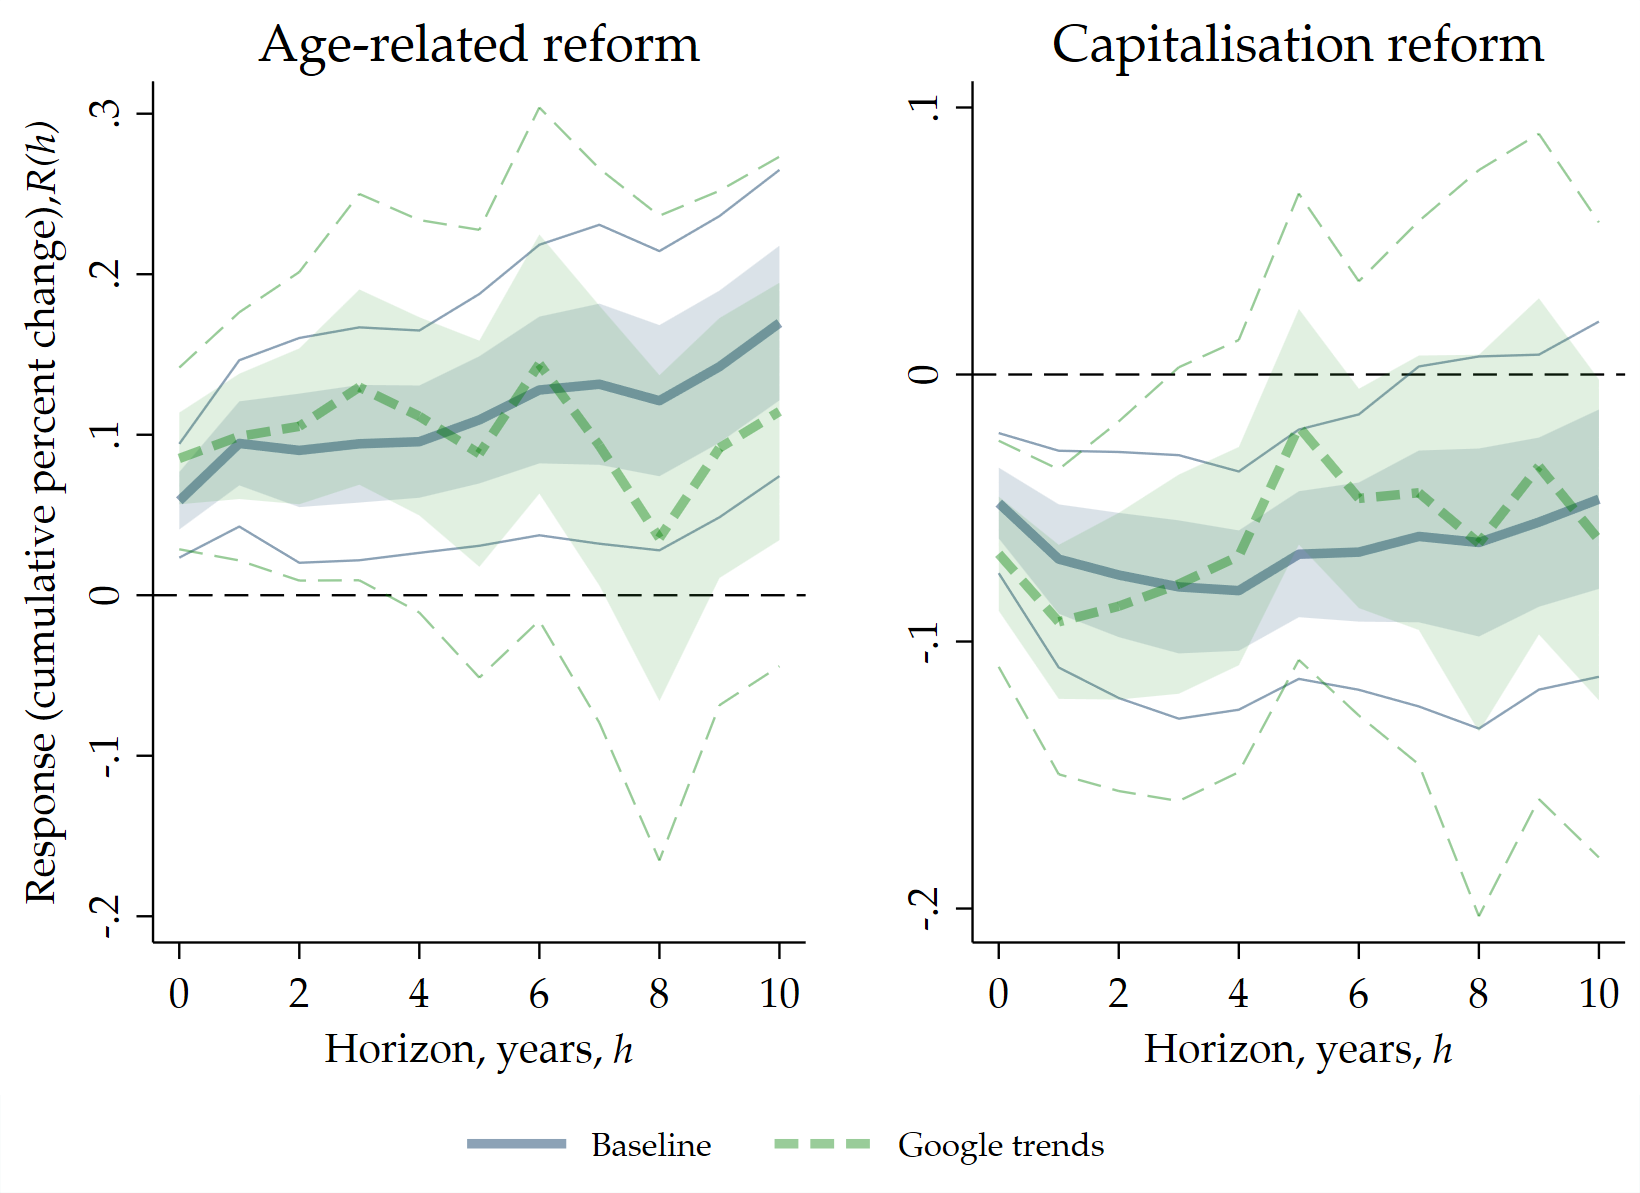
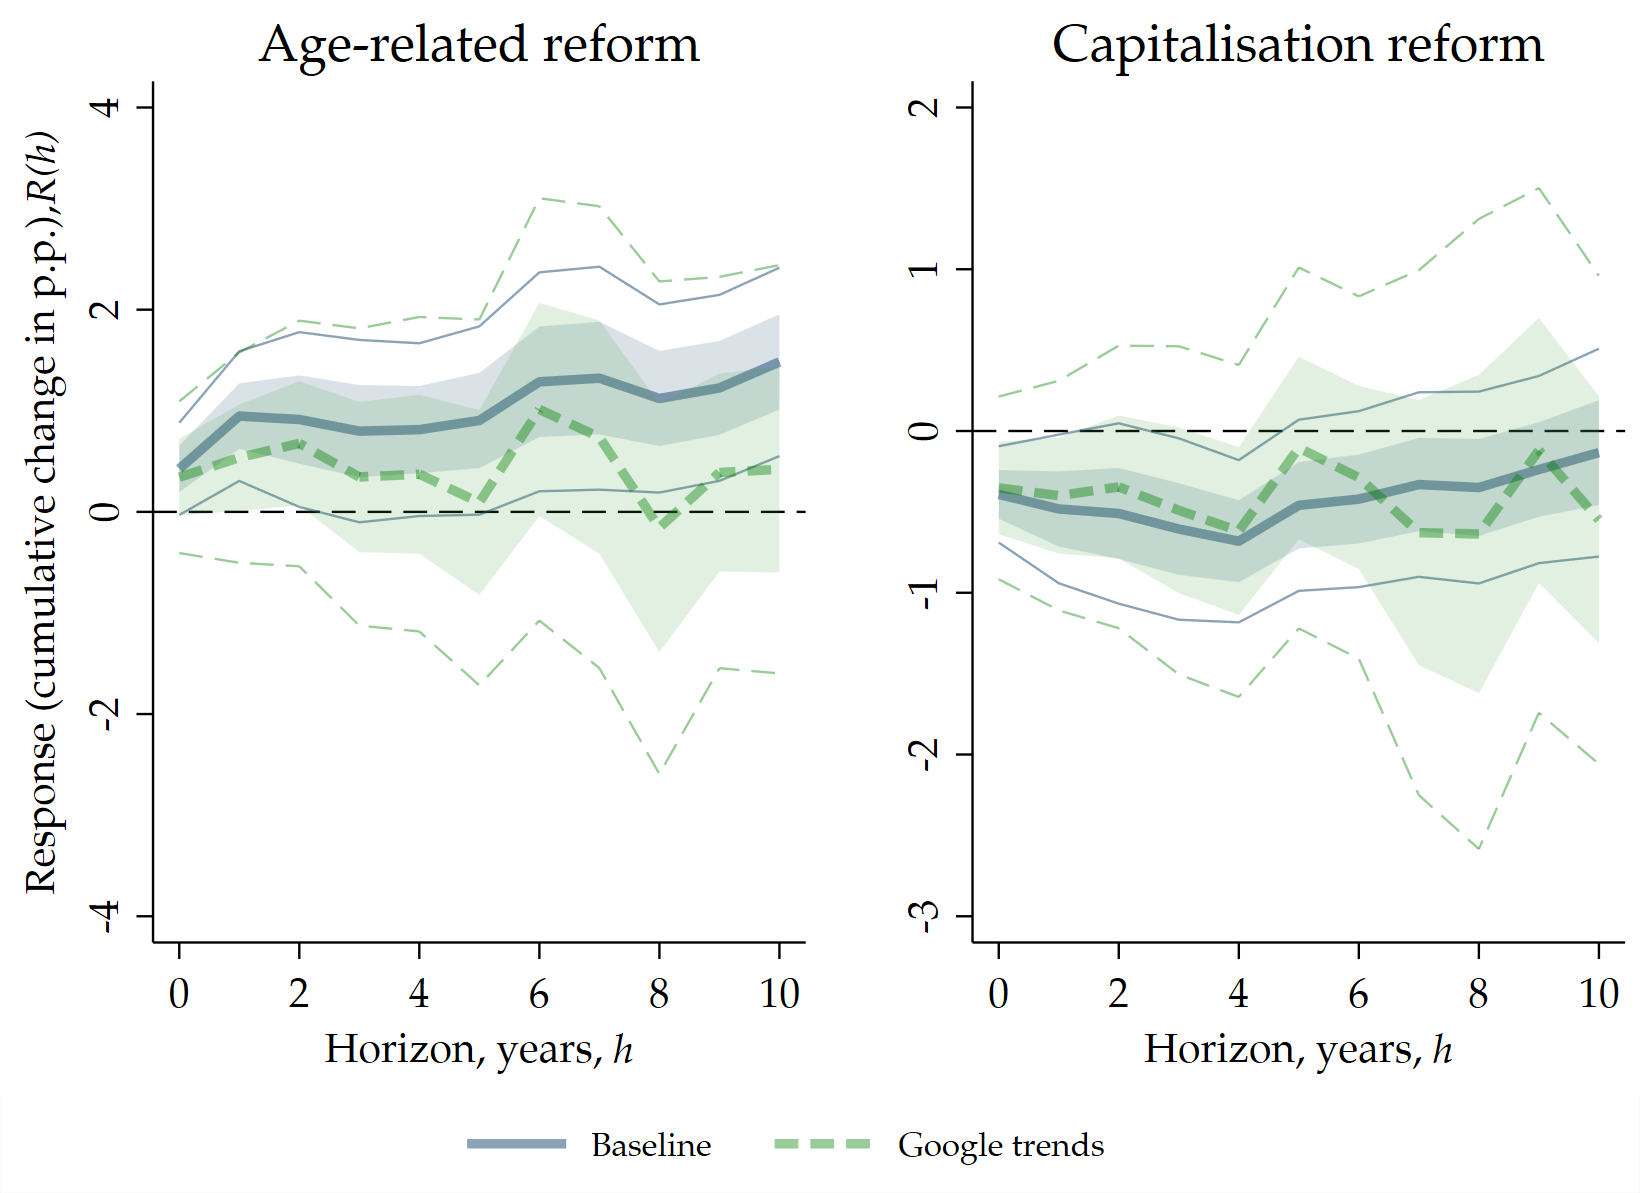
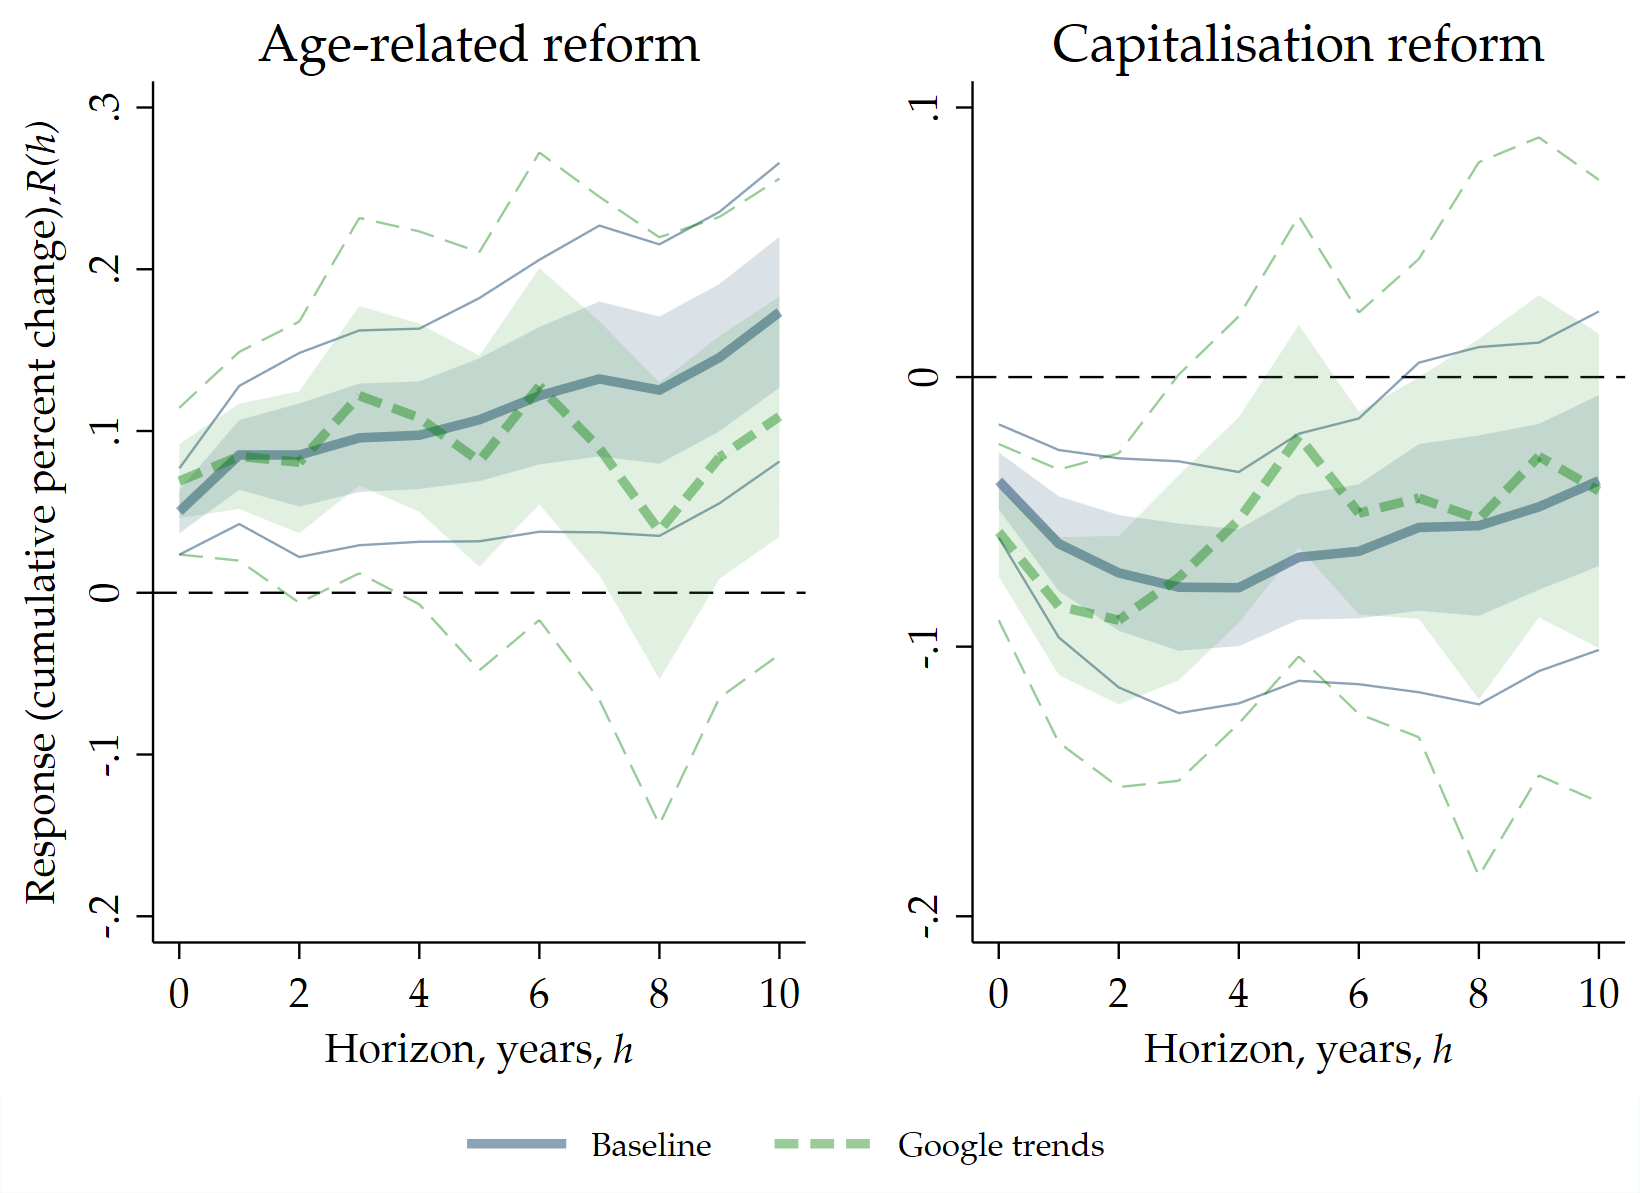
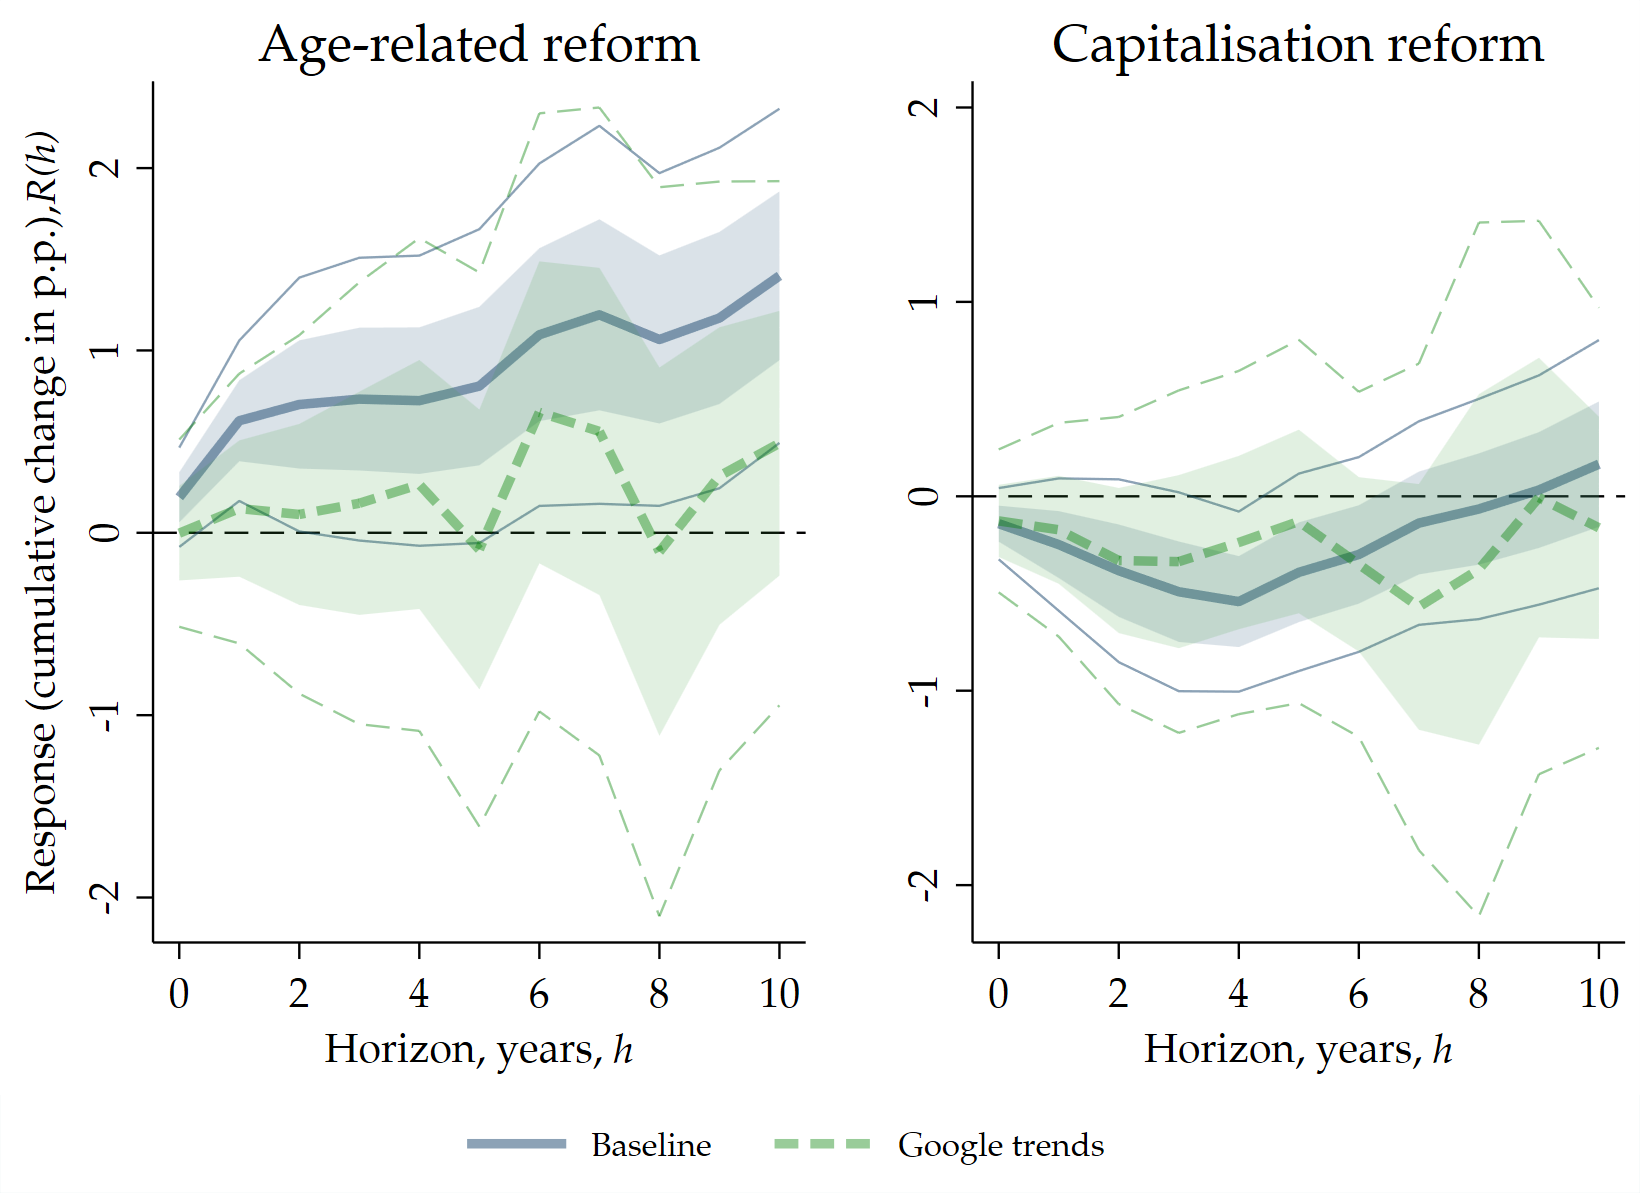
Notes: The figures report our baseline estimates alongside specifications that additionally control for uncertainty relying on Google Trends data (2004-2025). The baseline specification is extended to include, contemporaneously and with up to three lags, the domestic Google Trends data (domestic uncertainty) as well as the leave-one-out mean of Google Trends data (foreign uncertainty). LFPR denotes labour force participation rate. Inferences based on bootstrapped standard errors (1000 replications). Shaded areas (thin lines) denote the 68% (95%) pointwise confidence intervals.
Bibliography
Reuse
Citation
@article{blomme2026,
  author = {Blomme, Océane and Grekou, Carl and Grjebine, Thomas and
    Héricourt, Jérôme},
  title = {Annexes},
  journal = {Institut français d’économie working paper},
  number = {2026-14},
  date = {2026-11-18},
  url = {https://www.ofce.fr/wp/2026/14/},
  langid = {en}
}